Contents
About FSRA
About the Annual Information Return
About the 2022 mortgage brokerages and administrators Annual Information Return report
Mortgage brokerages overview
Key observations
Volume of mortgages
Financial institutions
Banks
Credit Unions
Insurance companies
Trust companies
Non-Financial institution/Alternative lenders
Mortgage finance companies
Self-funding
Mortgage investment corporations
Mortgage investment entities
Private lenders
Other lenders
Non-qualified syndicated mortgages
Mortgage administrators overview
Key observations - Mortgage administrators
Methodology
Appendix
About FSRA
The Financial Services Regulatory Authority of Ontario (FSRA) is an independent regulatory agency created to improve consumer and pension plan beneficiary protections in Ontario.
FSRA is self-funded and capable of responding to the dynamic pace of change in the marketplace, industry and consumer expectations.
About the Annual Information Return
This report summarizes the information provided in the 2022 Annual Information Return (AIR) by licensed mortgage brokerages and administrators about their business activities during the 2022 calendar year.
The AIR collects information about mortgage brokering and administration business volumes, practices, internal controls, and market conditions for a calendar year.
Under the Mortgage Brokerages, Lenders and Administrators Act, 2006 (MBLAA), all licensed mortgage brokerages and administrators are required to file the AIR by March 31 of each year, with data for the previous calendar year, even if they did not do any business during that calendar year. Mortgage brokerages and administrators that fail to file the AIR by the March 31 deadline have been subject to summary administrative penalties or other regulatory enforcement action.
The AIR filings help FSRA better understand the mortgage brokering sector as a whole and assess the overall compliance of mortgage brokerages and administrators with the MBLAA and FSRA’s Guidance.
FSRA uses its understanding of the sector’s business activities, compliance culture and market trends to inform its consumer protection measures, policy direction, the need for guidance to clarify regulatory requirements and regulatory action where there is evidence of non-compliance.
FSRA may flag an entity for examination based on a risk assessment of data elements reported in the AIR. Where examination findings indicate instances of non-compliance, FSRA may take enforcement action as appropriate. Enforcement actions may include Letters of Warning, licence conditions, suspension or revocation of a licence and/or administrative monetary penalties. Repeated instances of non-compliance would result in progressive enforcement action. Enforcement actions may be published in accordance with FSRA's Transparent Communication of FSRA Enforcement Action Guidance.
All licensed mortgage brokerages and administrators must meet their legal requirements under the MBLAA. FSRA encourages licensed brokerages and administrators to visit the Mortgage Brokering section on FSRA’s website to learn more about their legal obligations.
About the 2022 mortgage brokerages and administrators Annual Information Return report
The 2022 AIR Report (“Report”) provides an overview of the business activities in Ontario’s mortgage brokering and administration sectors based on data collected from brokerages and administrators through the 2022 AIR.
The 2022 data reflects AIR responses from:
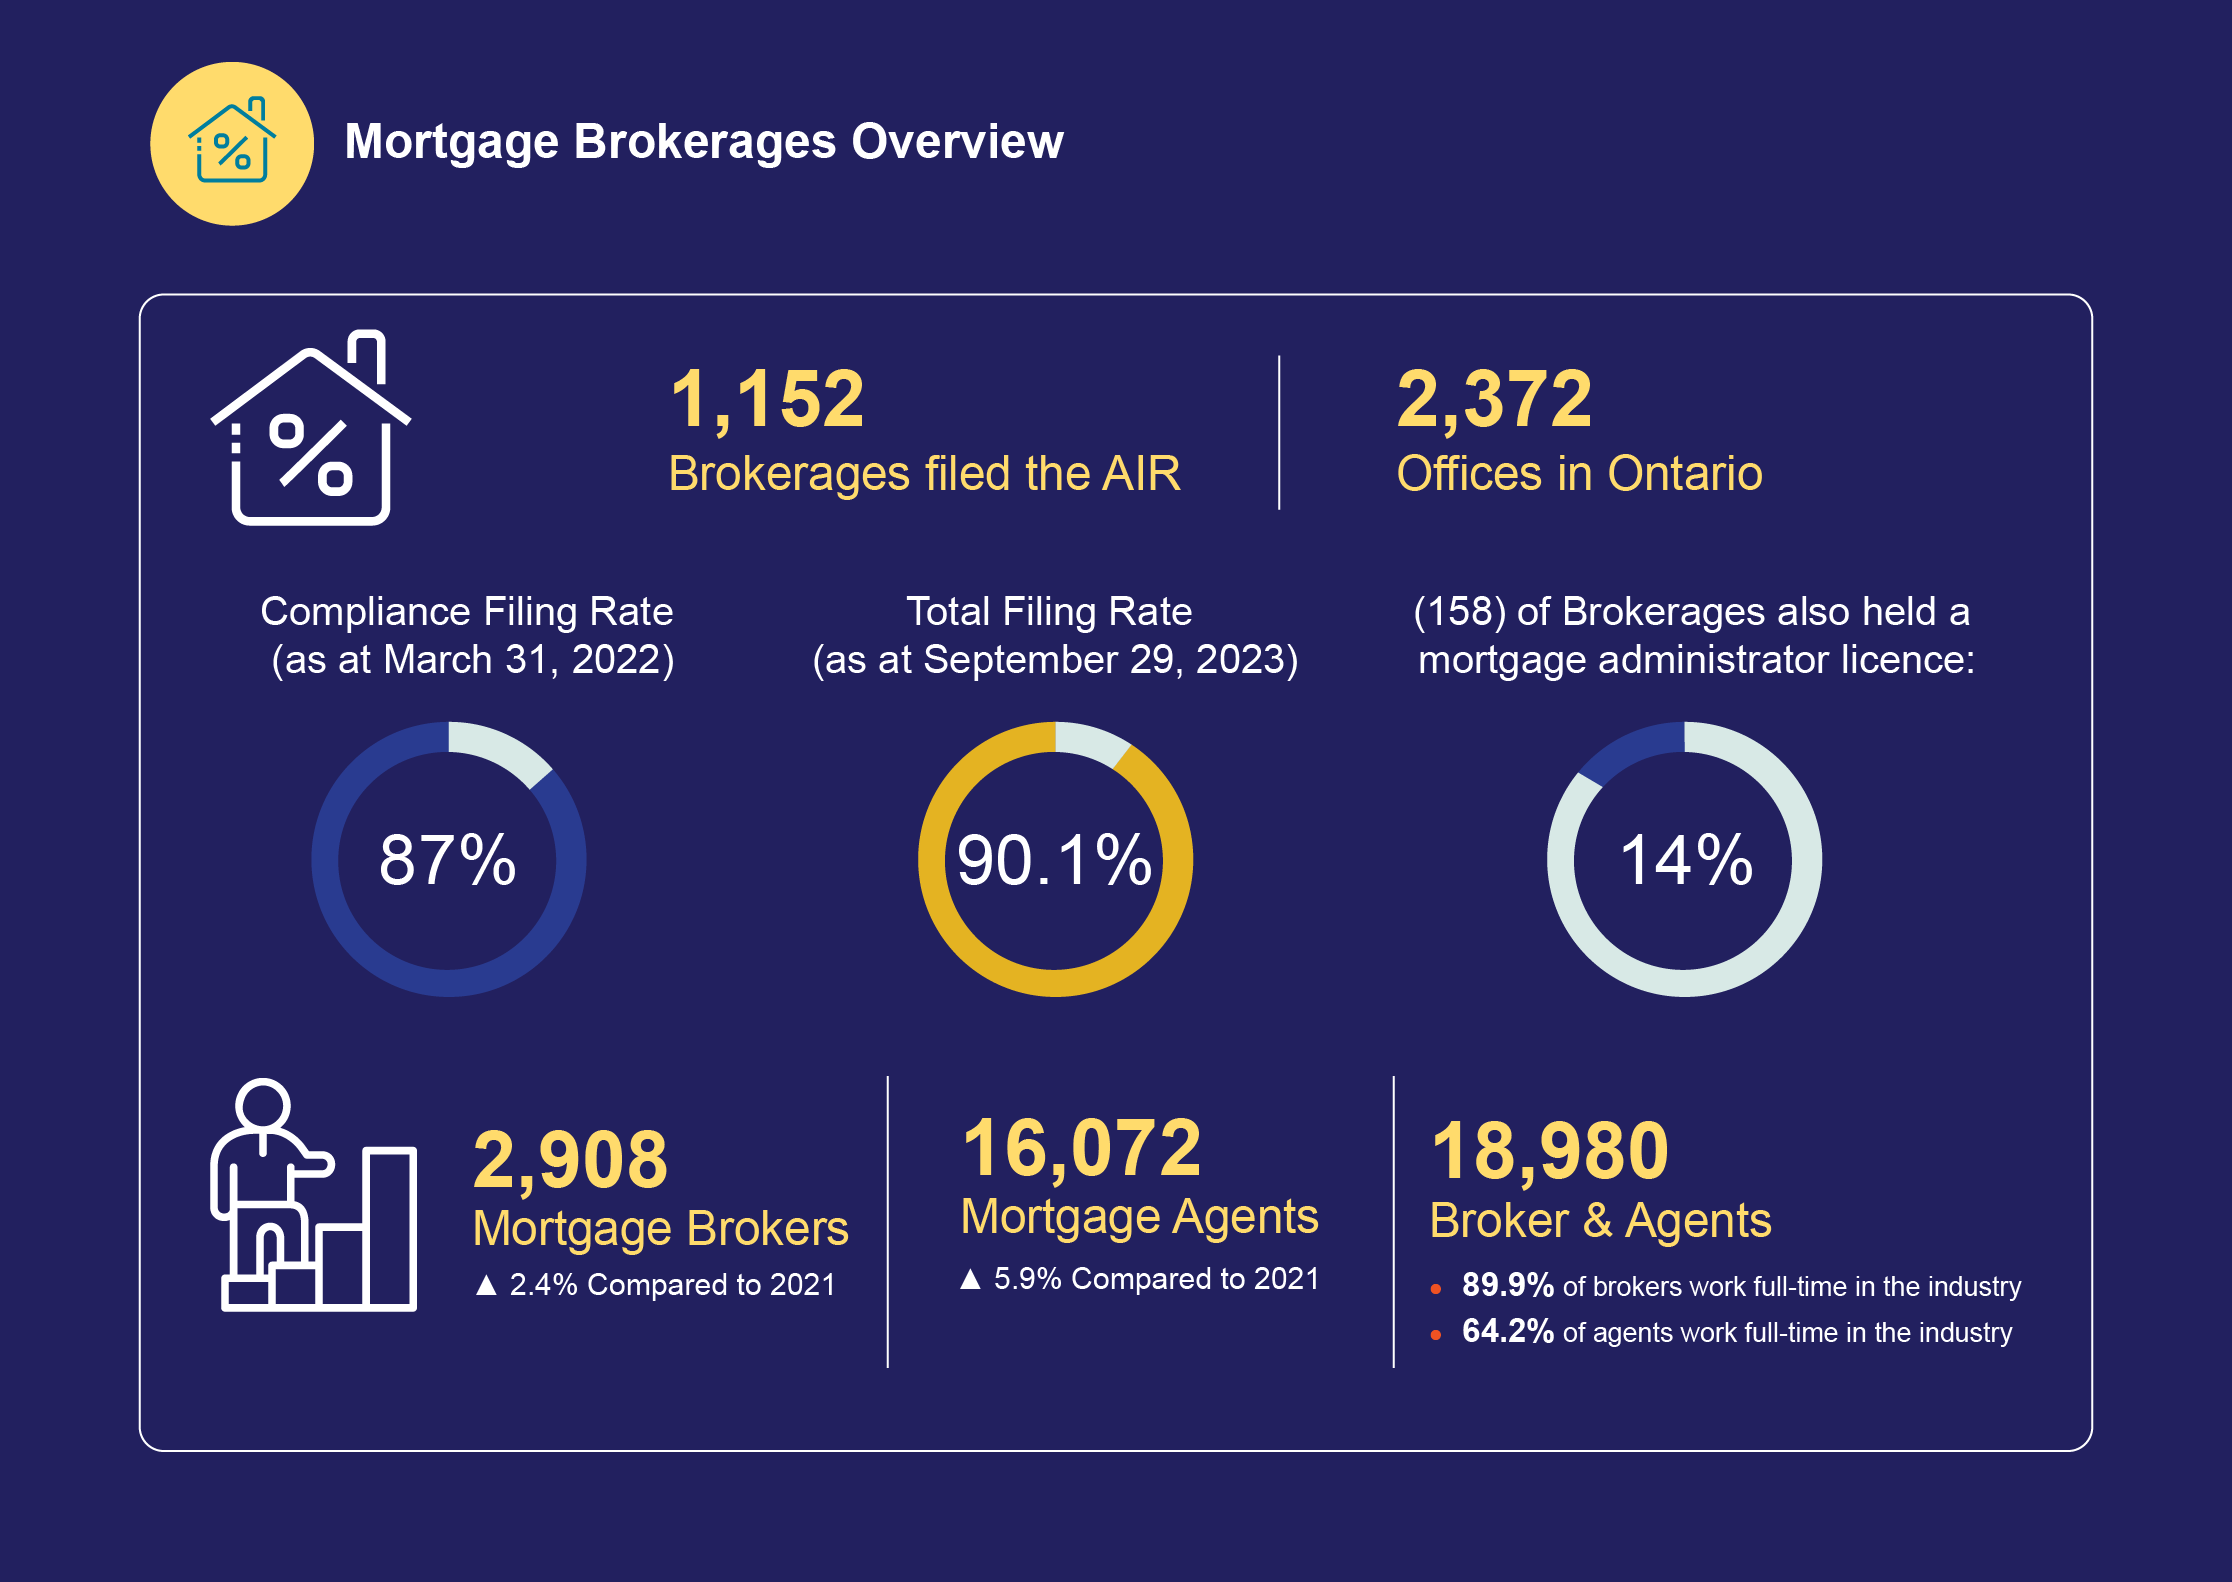
- 1,152 mortgage brokerages (vs 1,171 brokerages in 2021)
- 213 mortgage administrators (vs 213 administrators in 2021)
The compliance rate for filing (i.e., number of licensees filing the AIR by March 31 that are required to file[1]) in 2022 was:
- 87 per cent for mortgage brokerages
- 76 per cent for mortgage administrators
This report focuses on the volume of business (e.g., number and value of mortgages by type of mortgage and lender). It provides licensees and FSRA with key data insights about the mortgage brokering market segments. A summary of the aggregate responses to all the AIR questions is provided in Appendix A.
Mortgage brokerages overview
Image
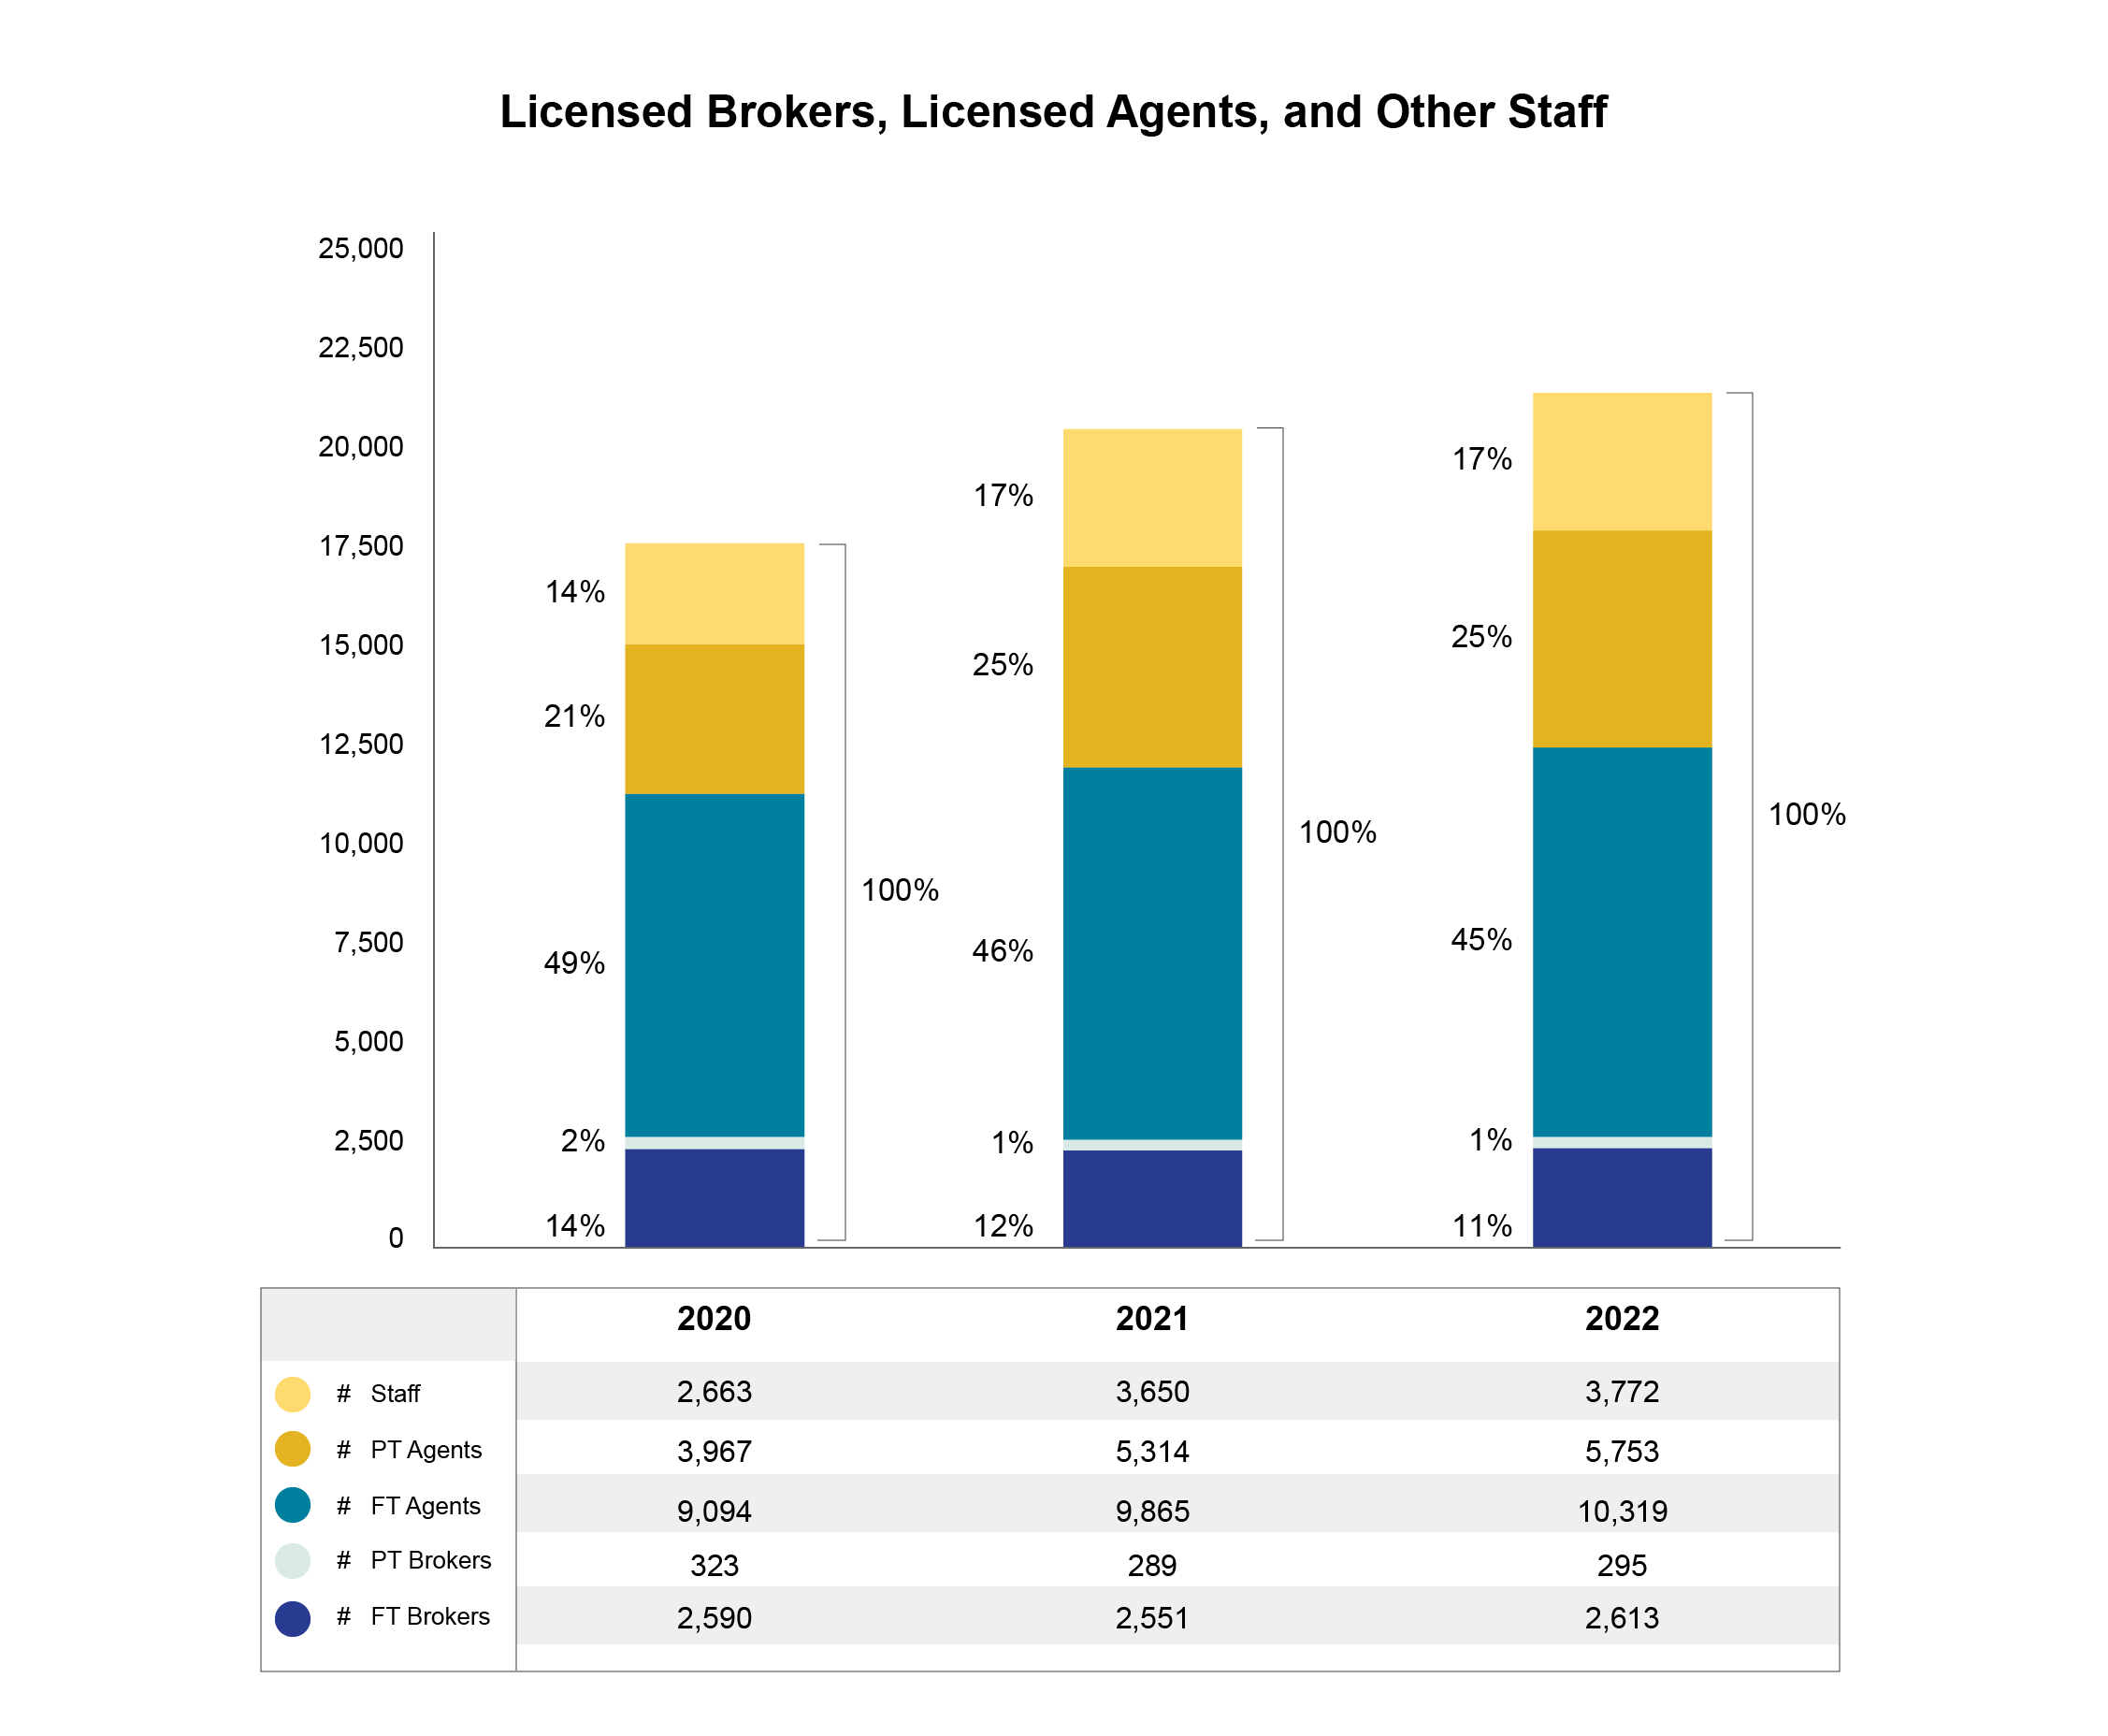
Licensed brokers, licensed agents, and other staff
Image
Key observations
Mortgage Brokerages
- The total dollar value of brokered mortgages decreased 1.5 per cent year-over-year in 2022 following three consecutive years of double-digit dollar value growth between 2019-2021. The total number of brokered mortgages decreased by 1.3 per cent year-over-year in 2022. This was the first consecutive year-over-year decline in the number of brokered transactions since 2017.
- The decrease in mortgage activity in 2022 reflected reduced demand for mortgages due to rising interest rates which fuelled increased costs of borrowing and a decrease in real estate sales and prices from 2021. Nonetheless, home prices at the end of 2022 remained well above pre-COVID-19 levels.[2]
- The Bank of Canada (BOC) raised the bank rate a total of 400 basis points (bps) in 2022 to fight inflation. These rate increases made it more expensive for consumers and businesses to borrow money through loans such as mortgages. This resulted in a decrease in real estate activity towards the latter half of 2022, and a decrease in total mortgage activity during the 2022 calendar year as the cumulative effect of consecutive rate increases took effect.
- There were notable year-over-year increases of 161.4 and 91 per cent in the dollar value of Reverse Mortgages and Home Equity Lines of Credit, respectively, in 2022.
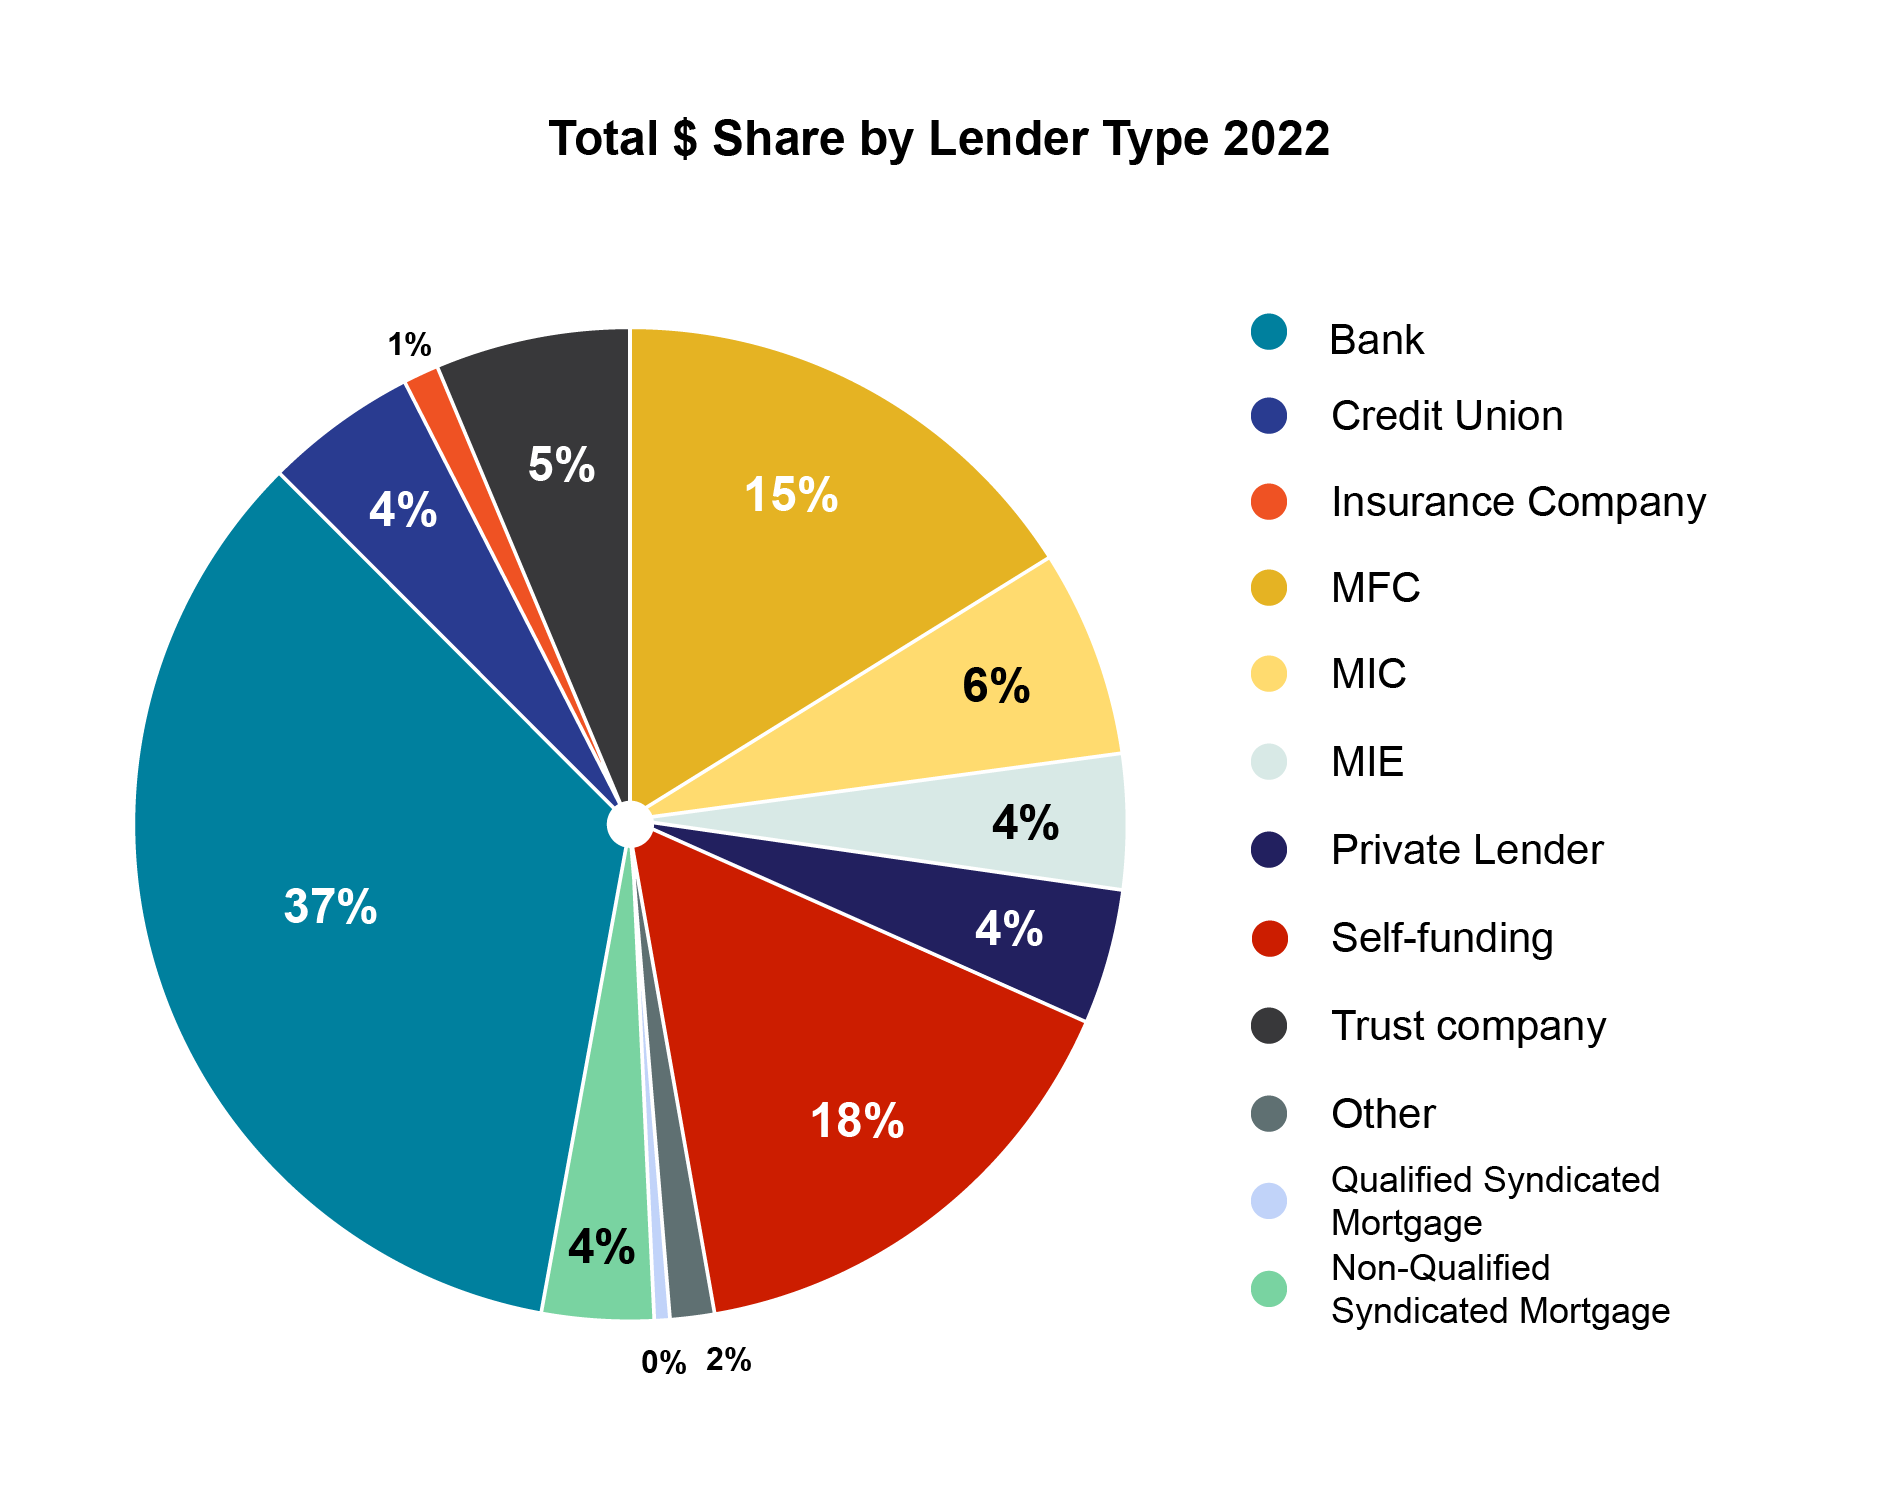
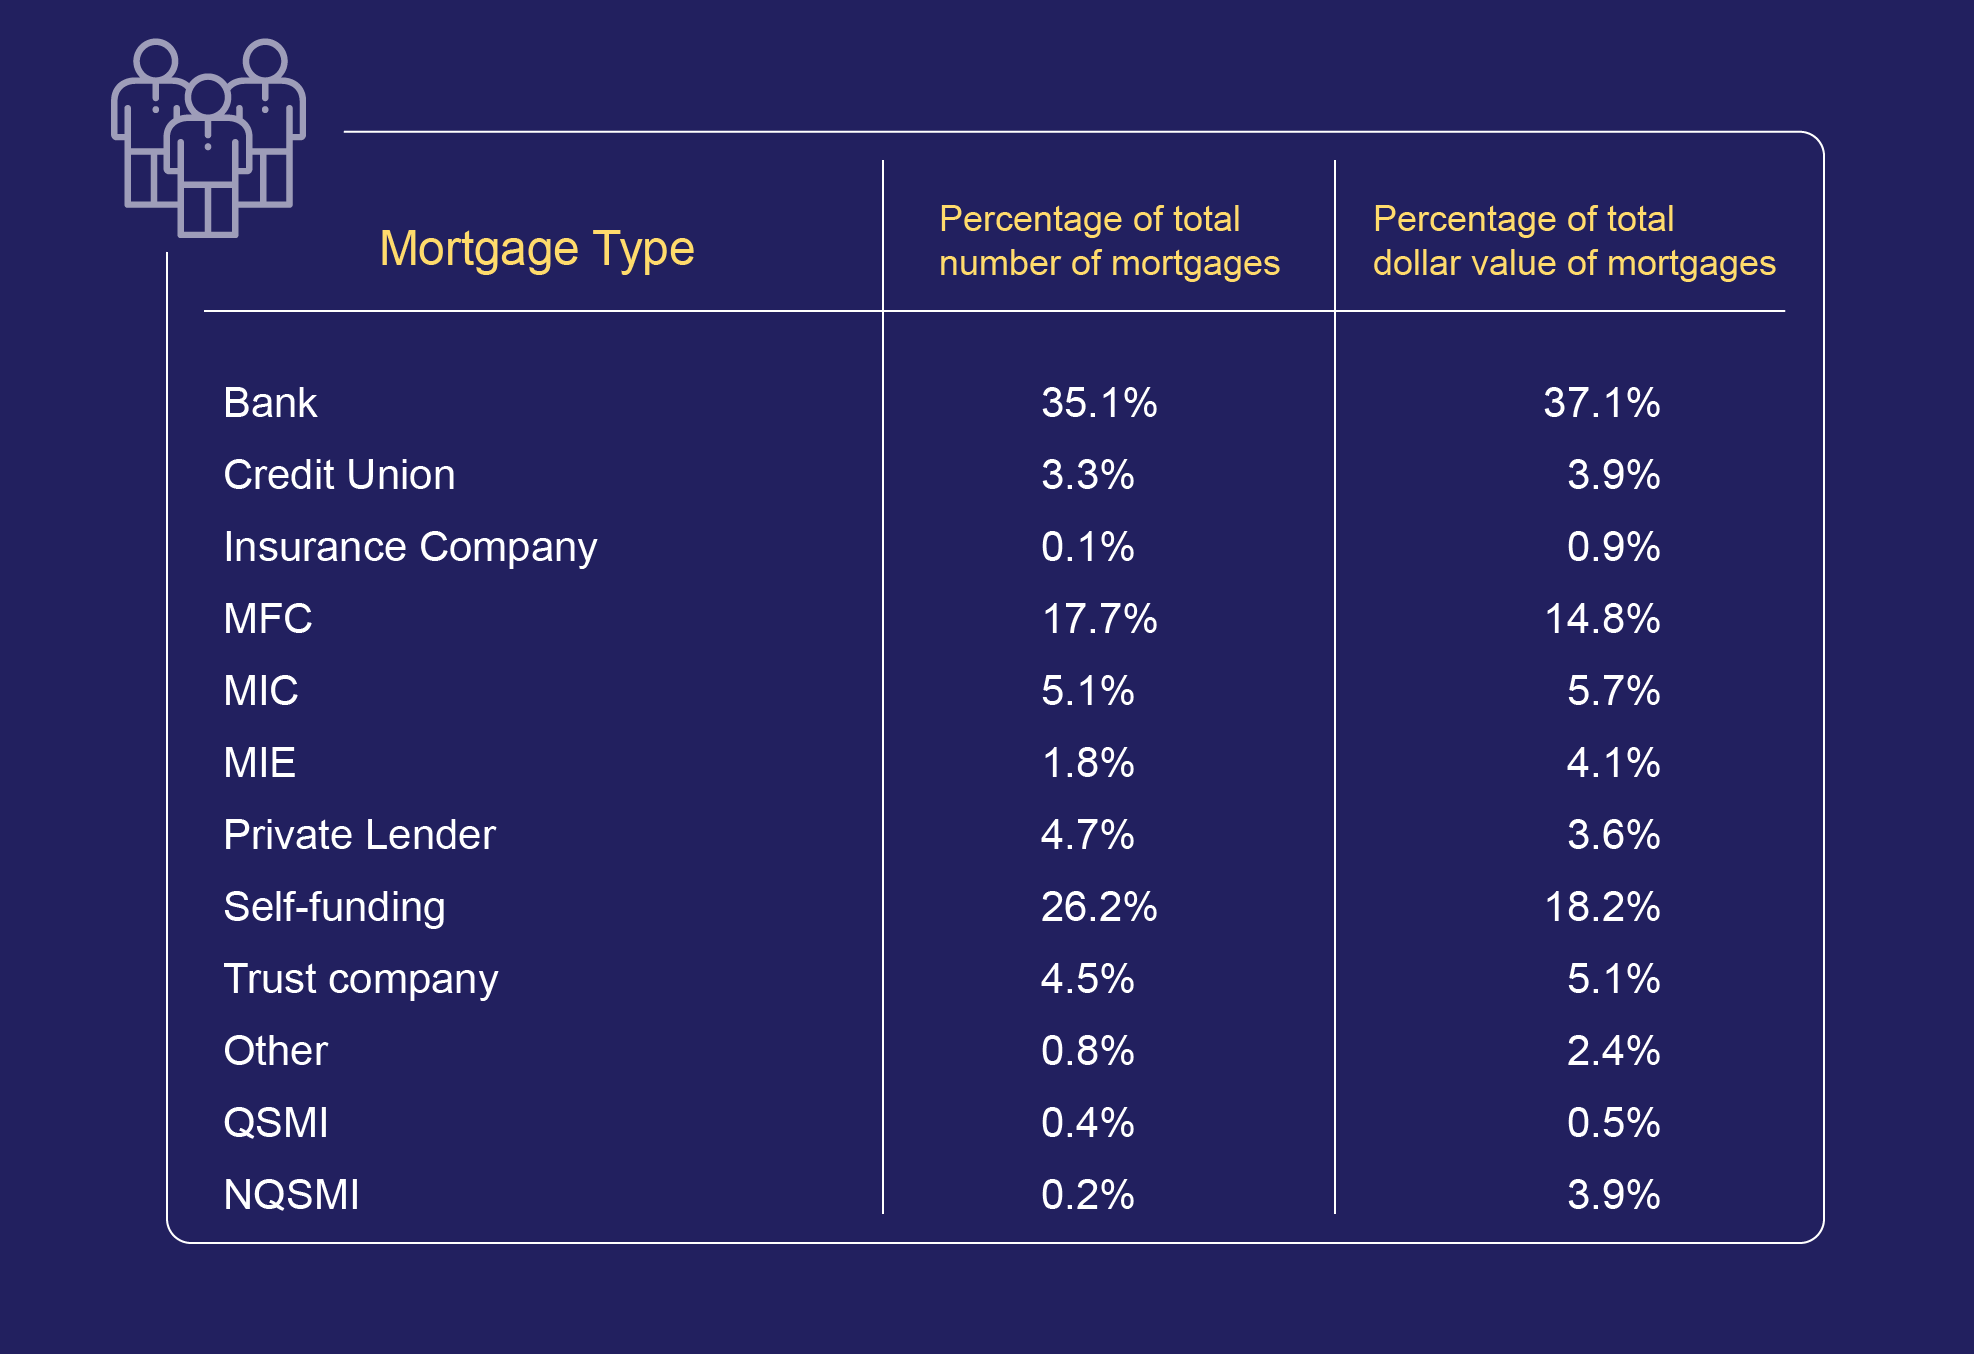
- Banks remained the largest source of mortgage funds for the sector, accounting for 37.1 per cent of the total value and 35.1 per cent of the total number of brokered mortgages in 2022. Despite being the largest funders, the market share of Banks in the mortgage brokering sector decreased significantly by 10 per cent in total number and dollar value in 2022 compared to 2021.
- In the Non-Financial Institutions/Alternative Lender category, funding by Mortgage Finance Companies (MFCs) declined by 8.1 per cent in dollar value. In contrast Mortgage Investment Corporations (MICs) and Self-funding lenders experienced the greatest year-over-year increases in the dollar value of mortgages funded, up 31.9 per cent and 55.1 per cent, respectively, in 2022.
Mortgage Administrators
- The total number and dollar value of mortgages under administration increased from 5.3 per cent to 6.2 per cent in 2022 from 2021.
Mortgage brokerages overview
Image
Volume of mortgages
Volume of mortgages refers to the number and value of mortgage transactions reported by the sector. The 2022 AIR data revealed the following about the volume of mortgages and sources of funding in Ontario:
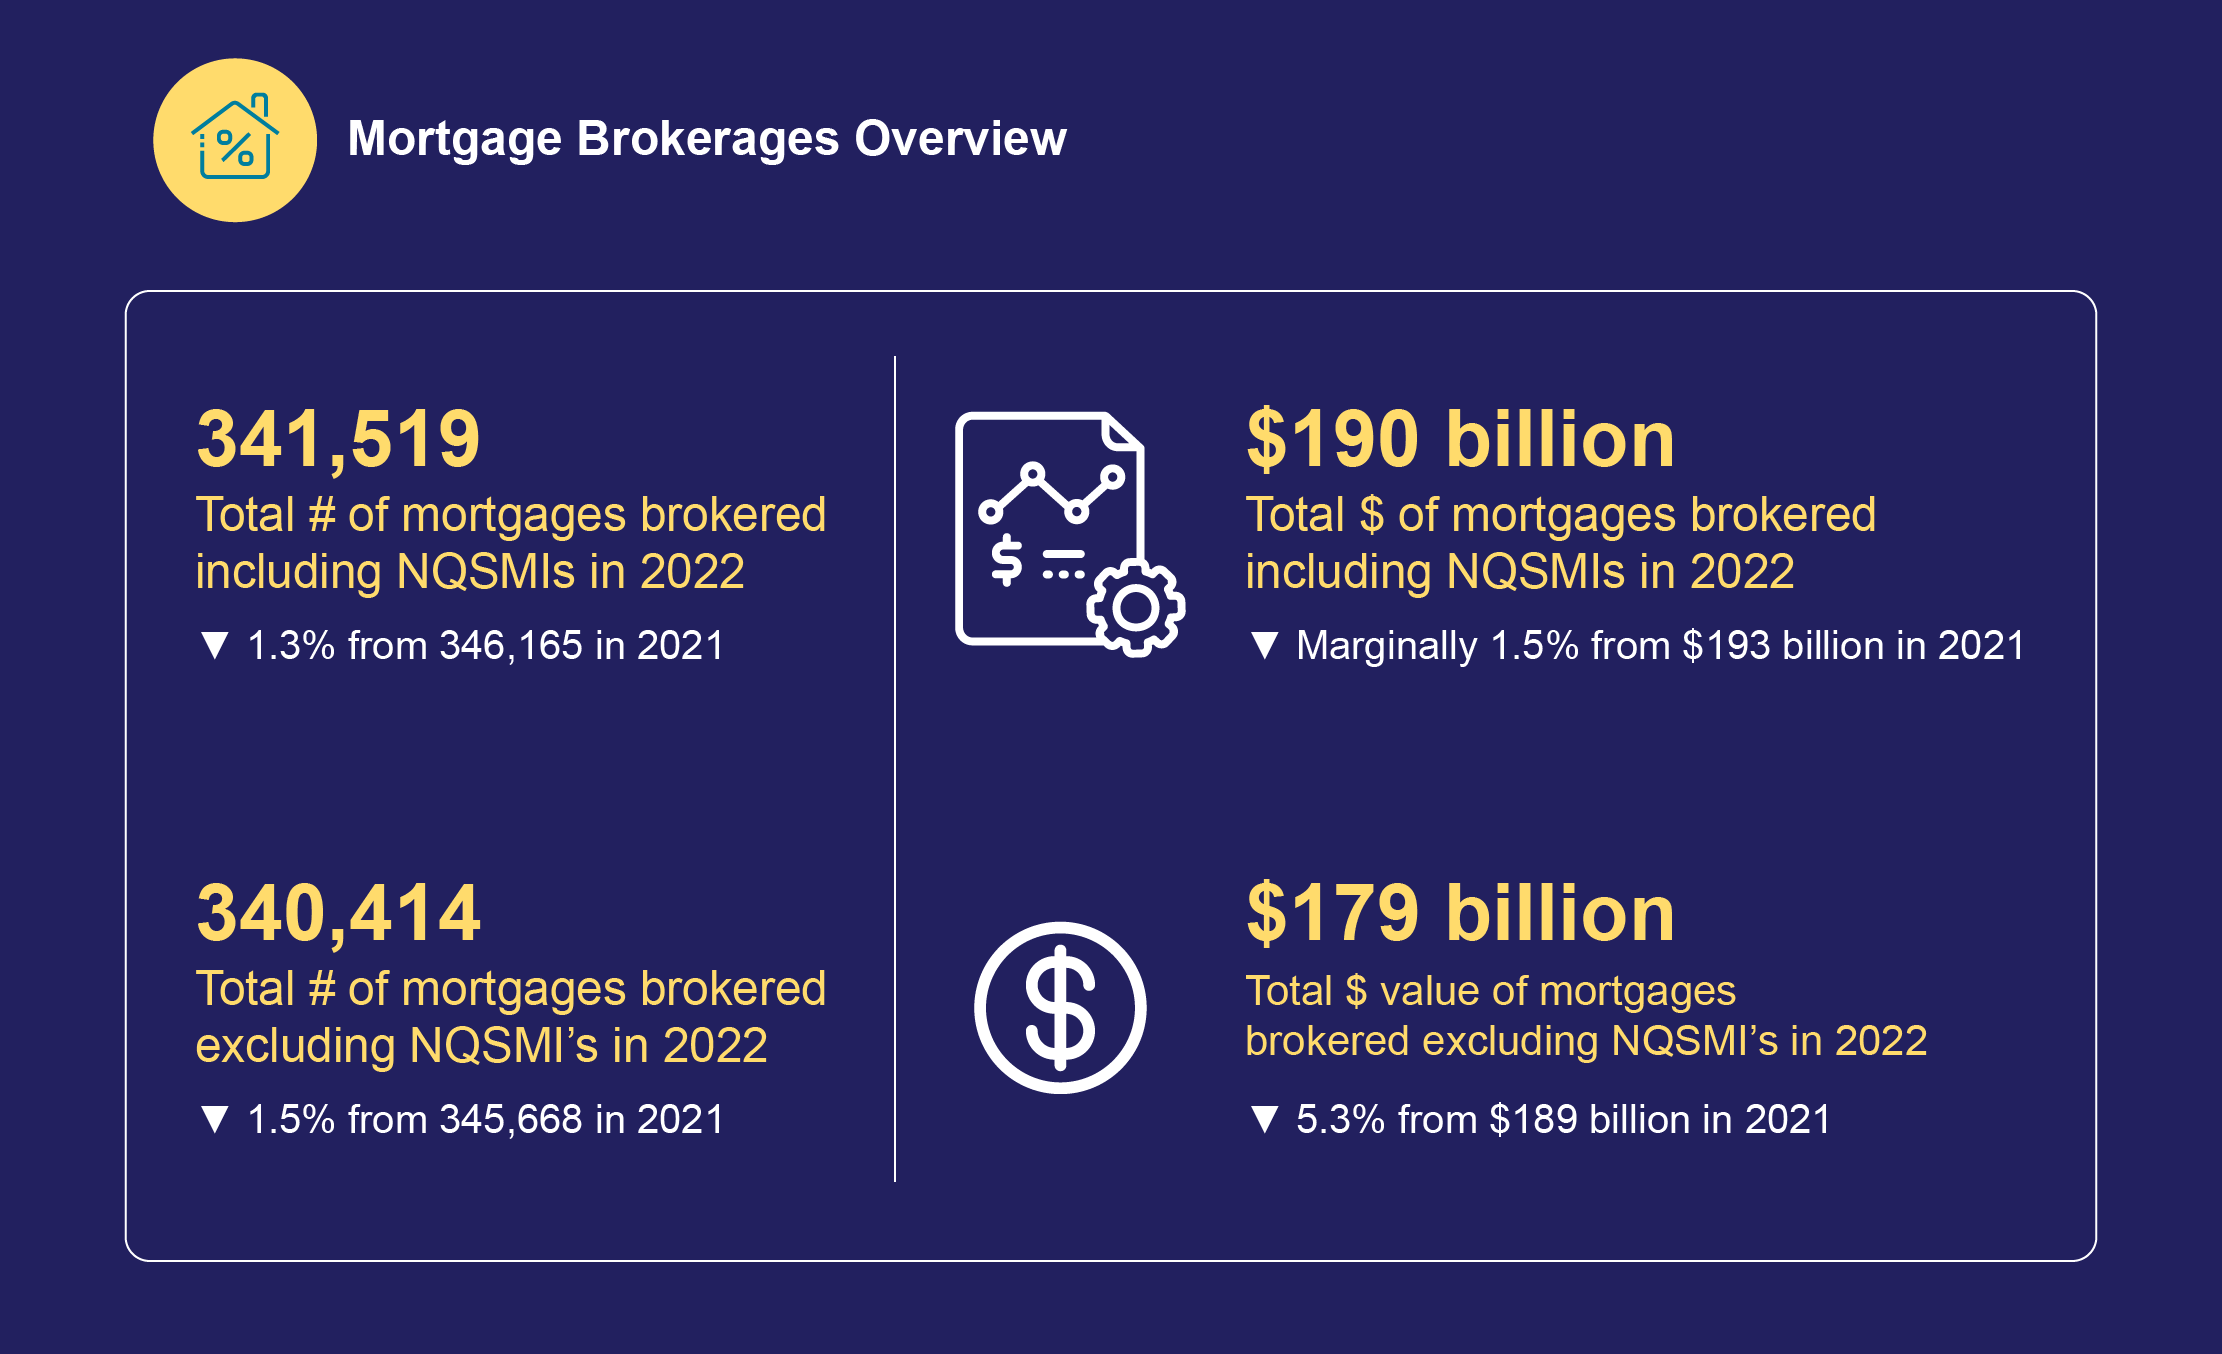
The total dollar value of mortgages arranged decreased by 1.5 per cent in 2022 to $190.2 billion from $193 billion in 2021 alongside a marginal decline in the number of mortgages arranged.
The total number of mortgages arranged declined by 1.3 per cent to 341,519 in 2022 from 346,165 in 2021. This was the first decline since 2017.
The decrease in mortgages primarily reflected the slowdown in the residential mortgage market due to rising interest rates.
Residential
- The value of residential mortgages arranged increased marginally by 0.7 per cent in 2022 to $150.2 billion from $149.2 in 2021.
- The number of residential mortgages arranged decreased by 0.4 per cent to 336,070 from 337,328 in 2021, reflecting the slowdown in real estate transactions during 2022 following interest rate hikes by the Bank of Canada.
- Residential mortgages account for approximately 79 per cent of the total value of brokered mortgages and 97.3 per cent of the total number of brokered mortgages.
- The average value of a residential mortgage rose to $446,918 in 2022 from $442,216 in 2021.
Commercial
- The value of commercial mortgages arranged increased by 13 per cent in 2022 to $36.4 billion from $32.2 billion in 2021. Given the typically larger values of commercial mortgages, these loans accounted for approximately 19.2 per cent of the total value of brokered mortgages and 1.4 per cent of the total number of brokered mortgages.
- The number of commercial mortgages increased by 4.4 per cent to 5,006 in 2022 from 4,797 in 2021.
Other[3] mortgages
- The dollar value of other mortgages arranged increased by 333.1 per cent in 2022 to $3.6 billion from $820 million in 2021. While the increase in the dollar value of Other mortgages was large, the market share is relatively small, accounting for 1.9 per cent of the total dollar value of mortgages.
- The number of other mortgages increased by 65.3 per cent to 443 in 2022 from 268 in 2021.
Conventional[4]
- The value of conventional mortgages (residential, commercial and other) rose 3 per cent in 2022 to $150 billion from $145.6 billion in 2021. The number of conventional mortgages decreased 2.12 per cent to 269,783 over the same period.
- The average conventional mortgage dollar amount rose 5.2 per cent in 2022 to $556,090 from $528,680 in 2021.
Insured and uninsured high ratio
- The value of insured high-ratio mortgages increased 24 per cent in 2022 from 2021 to $36.5 billion, primarily reflecting a 21.4 per cent increase in the number of these mortgages.
- The average amount of an insured high-ratio mortgage was up 2 per cent in 2022 to $567,481 from $555,859 in 2021.
- The value of uninsured high-ratio mortgages rose 18.2 per cent in 2022 from 2021 to $3.6 billion despite a 3.3 per cent decline in the number of uninsured mortgages.
- The average amount of an uninsured high-ratio mortgage was up 22.3 per cent in 2022 to $493,349 from $403,409 in 2021.
- Default insurers place a $1,000,000 limit on the purchase price of a home they will insure. Given the increase in home prices, homes previously eligible for default insurance, no longer qualify. This partially explains the increase in the value of uninsured high-ratio mortgages.
Secondary mortgage classifications
The Secondary Mortgage Classifications in the AIR are intended to help further our understanding of specific market segments. These classifications in the AIR include the following types of mortgages:
- Qualified Syndicated Mortgage (QSM)
- First-time Home Buyer (FTHB)
- Construction and development
- Reverse
- Sub-prime[5]
- Home Equity Line of Credit (HELOC)
- Non-Qualified Syndicated Mortgages (NQSMI)
- Equity-Based Lending[6]
The above classifications are not-mutually exclusive. That is, a mortgage can be classified as both a First-time Home Buyer and Sub-Prime mortgage and would be counted in both of these secondary classifications. In addition, some mortgages may not fall within any of the secondary classifications (e.g., it’s not a FTHB, reverse or construction and development mortgage, etc.). Mortgages that do not fall within a Secondary Classification are, however, included in the overall total of mortgages. Hence, the total volume of the Secondary Mortgage Classification may not be the same as the total for all mortgages.
- There were strong increases in Reverse mortgages and Home Equity Lines of Credit (HELOCs) in 2022 from 2021.
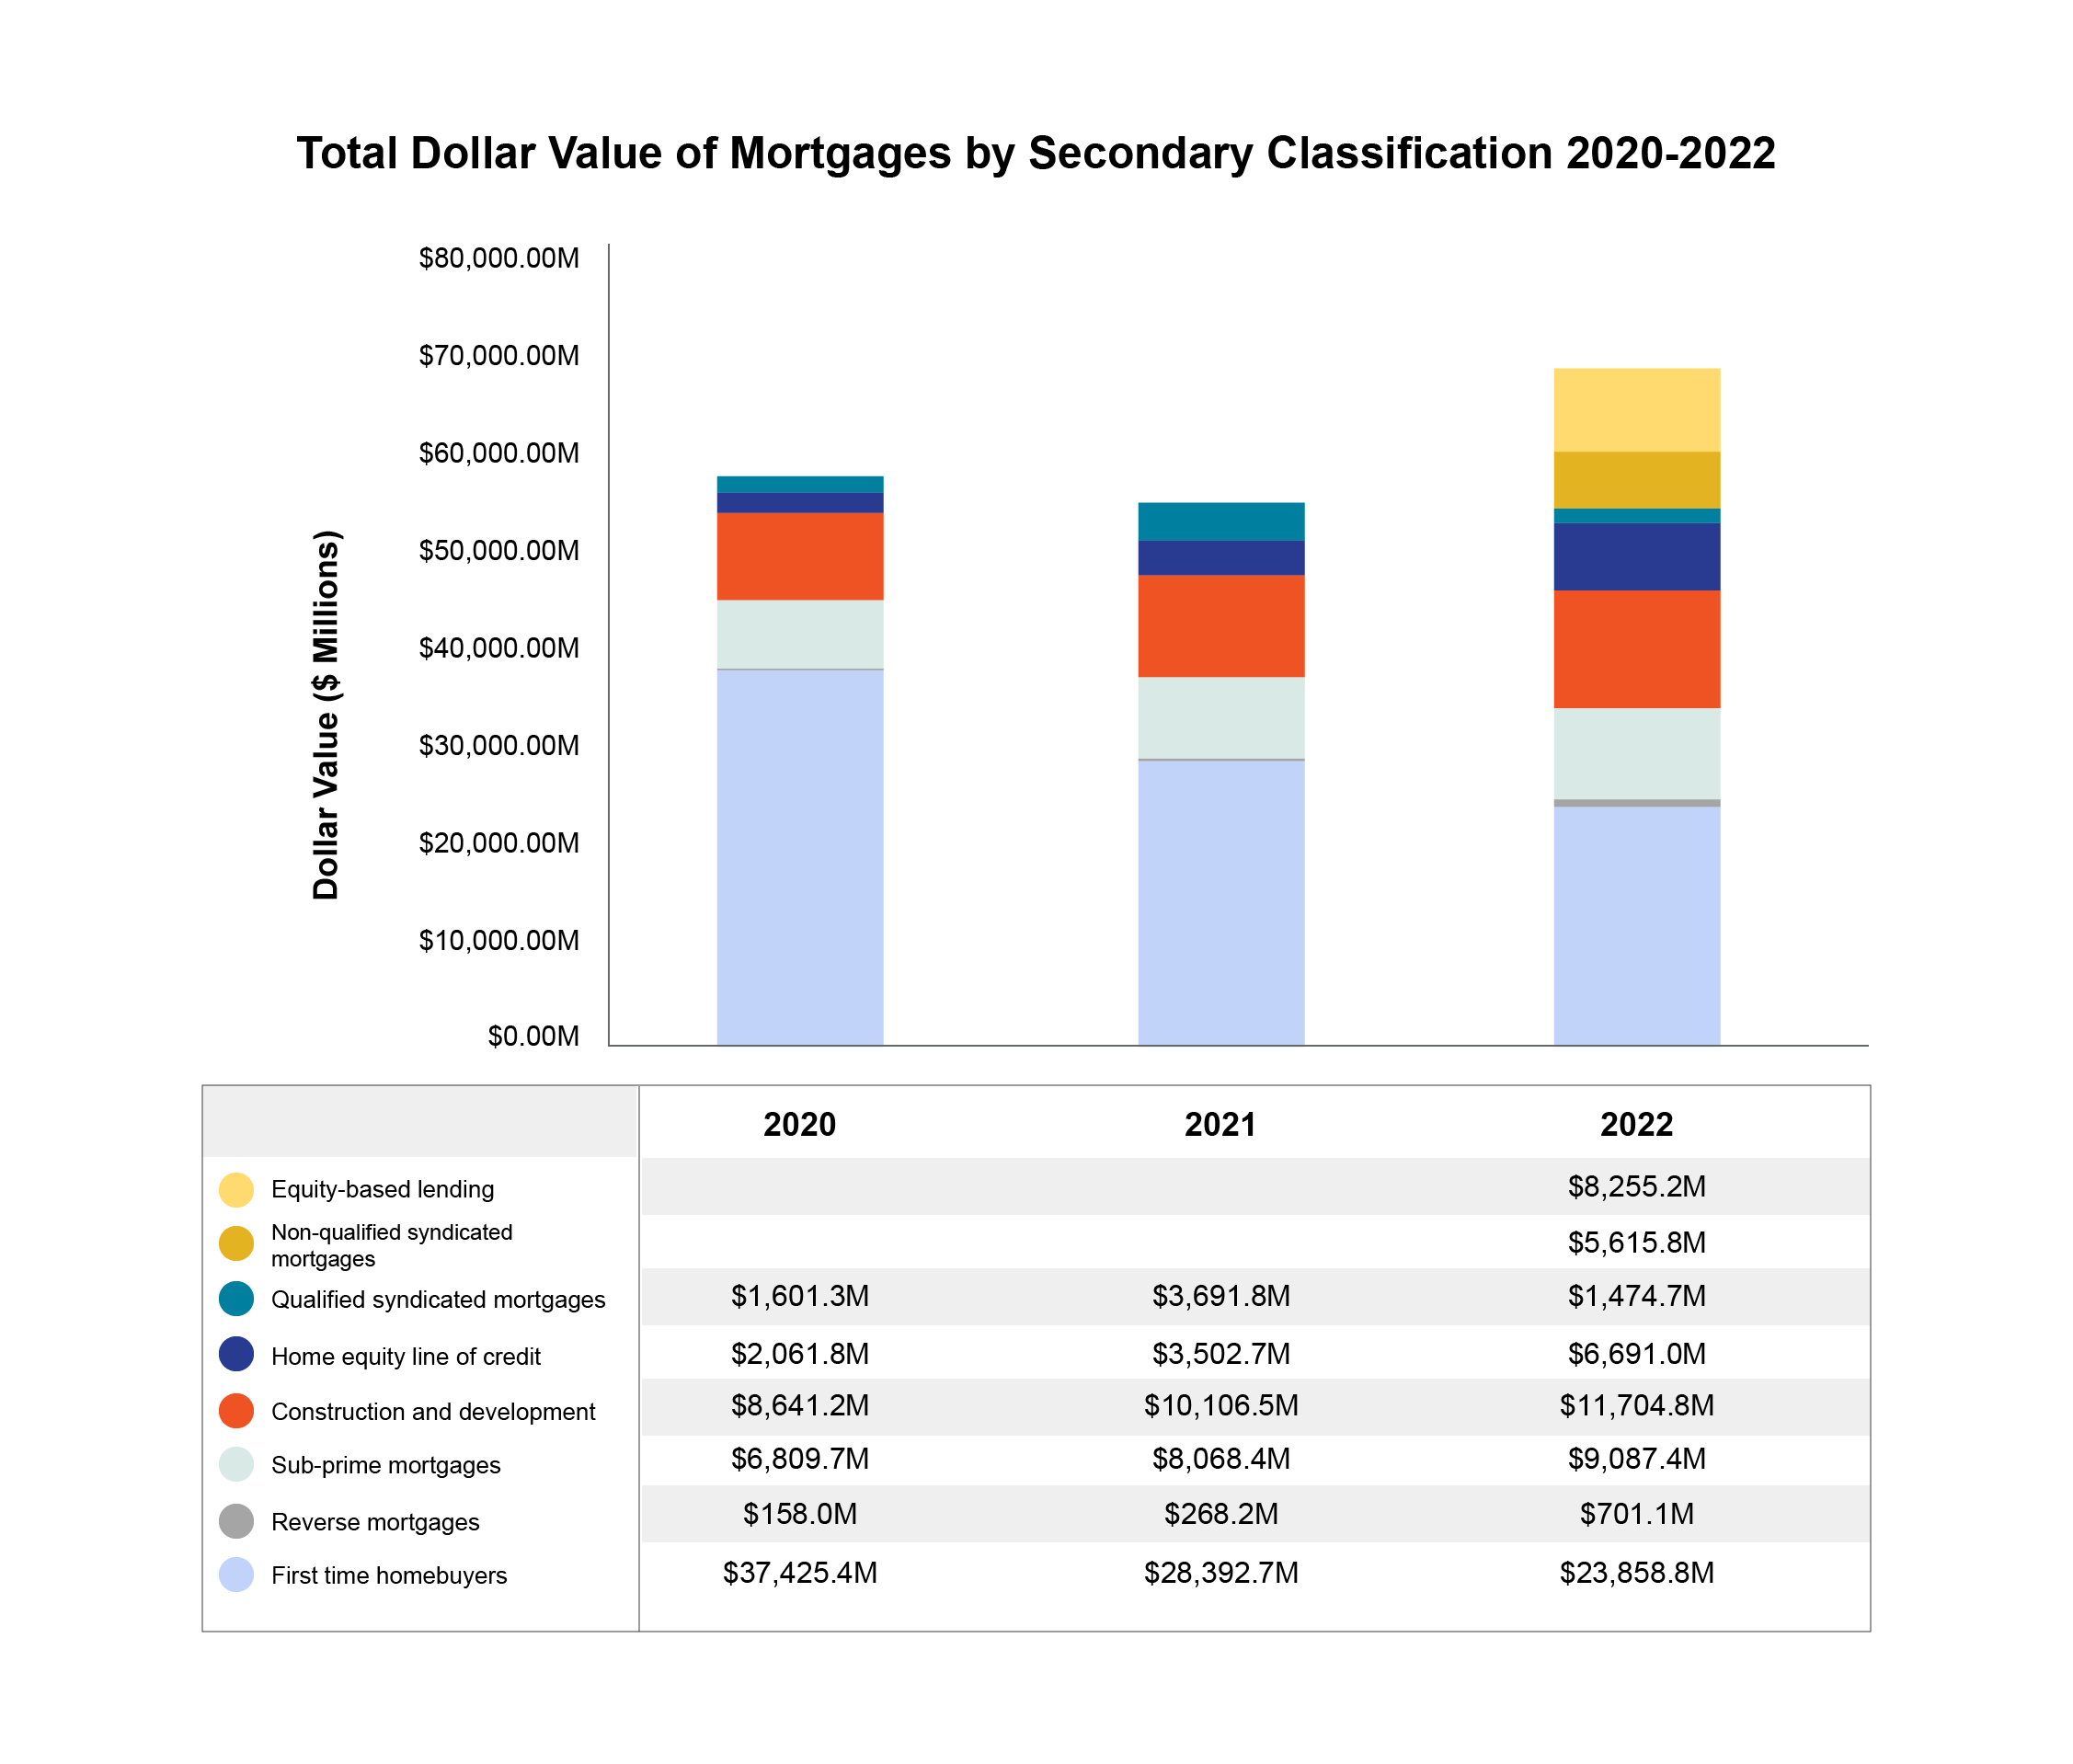
- The value of reverse mortgages increased by 161.4 per cent in 2022 from 2021 to $701.1 million. The number increased by 52.6 per cent over the same period to 1,277 (up 149 per cent since 2017).
- The value of HELOCs rose by 91 per cent in 2022 from 2021 to $6.7 billion. The number of HELOCs rose by 81.1 per cent over the same period to 17,922 (up 98 per cent since 2017).
- These upward trends likely reflected homeowners leveraging the increased values of their homes to meet various goals (e.g., aging at home, gifting down payments to children or grandchildren, renovation, subsidizing costs of daily living due to inflation).
- The value of QSMs decreased by 60.1 per cent in 2022 from 2021 to $1.5 billion. The number of QSMs decreased 62.4 per cent in the same period to 2,522. The decrease is a strong reversal from the gains experienced in this category from 2020 to 2021.
- The value of construction and development mortgages rose 15.8 per cent to $11.7 billion in 2022 from 2021.The number of construction and development mortgages rose by 17.6 per cent in 2022 from 2021 to 2,073.
- The value of FTHB mortgages decreased by 16 per cent in 2022 from 2021 to $23.9 billion. The number of first-time homebuyer mortgages declined 21.2 per cent in 2022 from 2021 to 45,738. This data aligns with the high interest rates and uncertain market environment during the 2022 reporting year.
- The value of sub-prime mortgages rose by 12.6 per cent in 2022 from 2021 to $9.1 billion. The number of sub-prime mortgage transactions increased slightly by 1.7 per cent in 2022 from 2021 to 22,391.
Image
Sources of lending
Image
Financial institutions
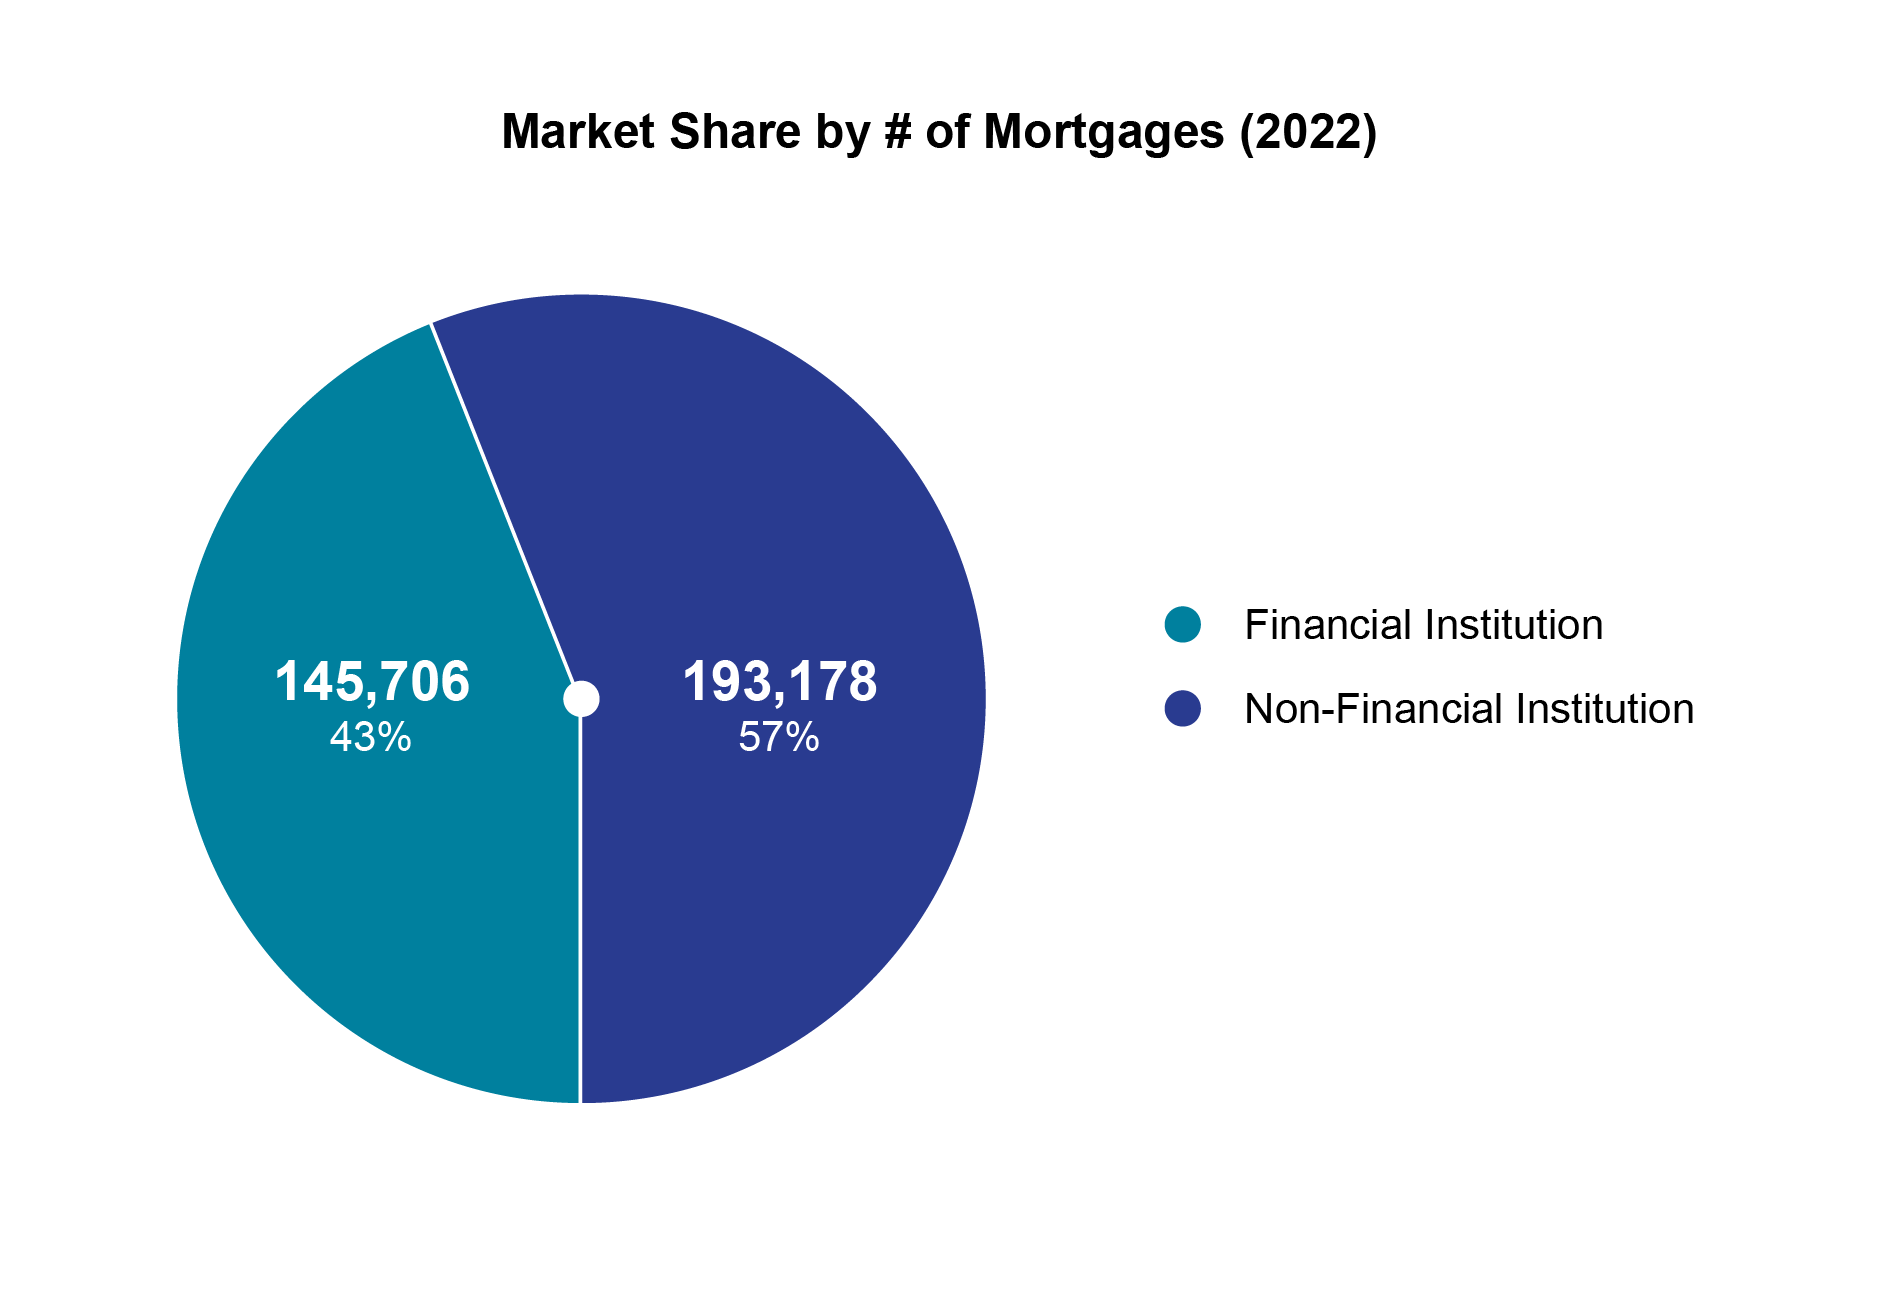
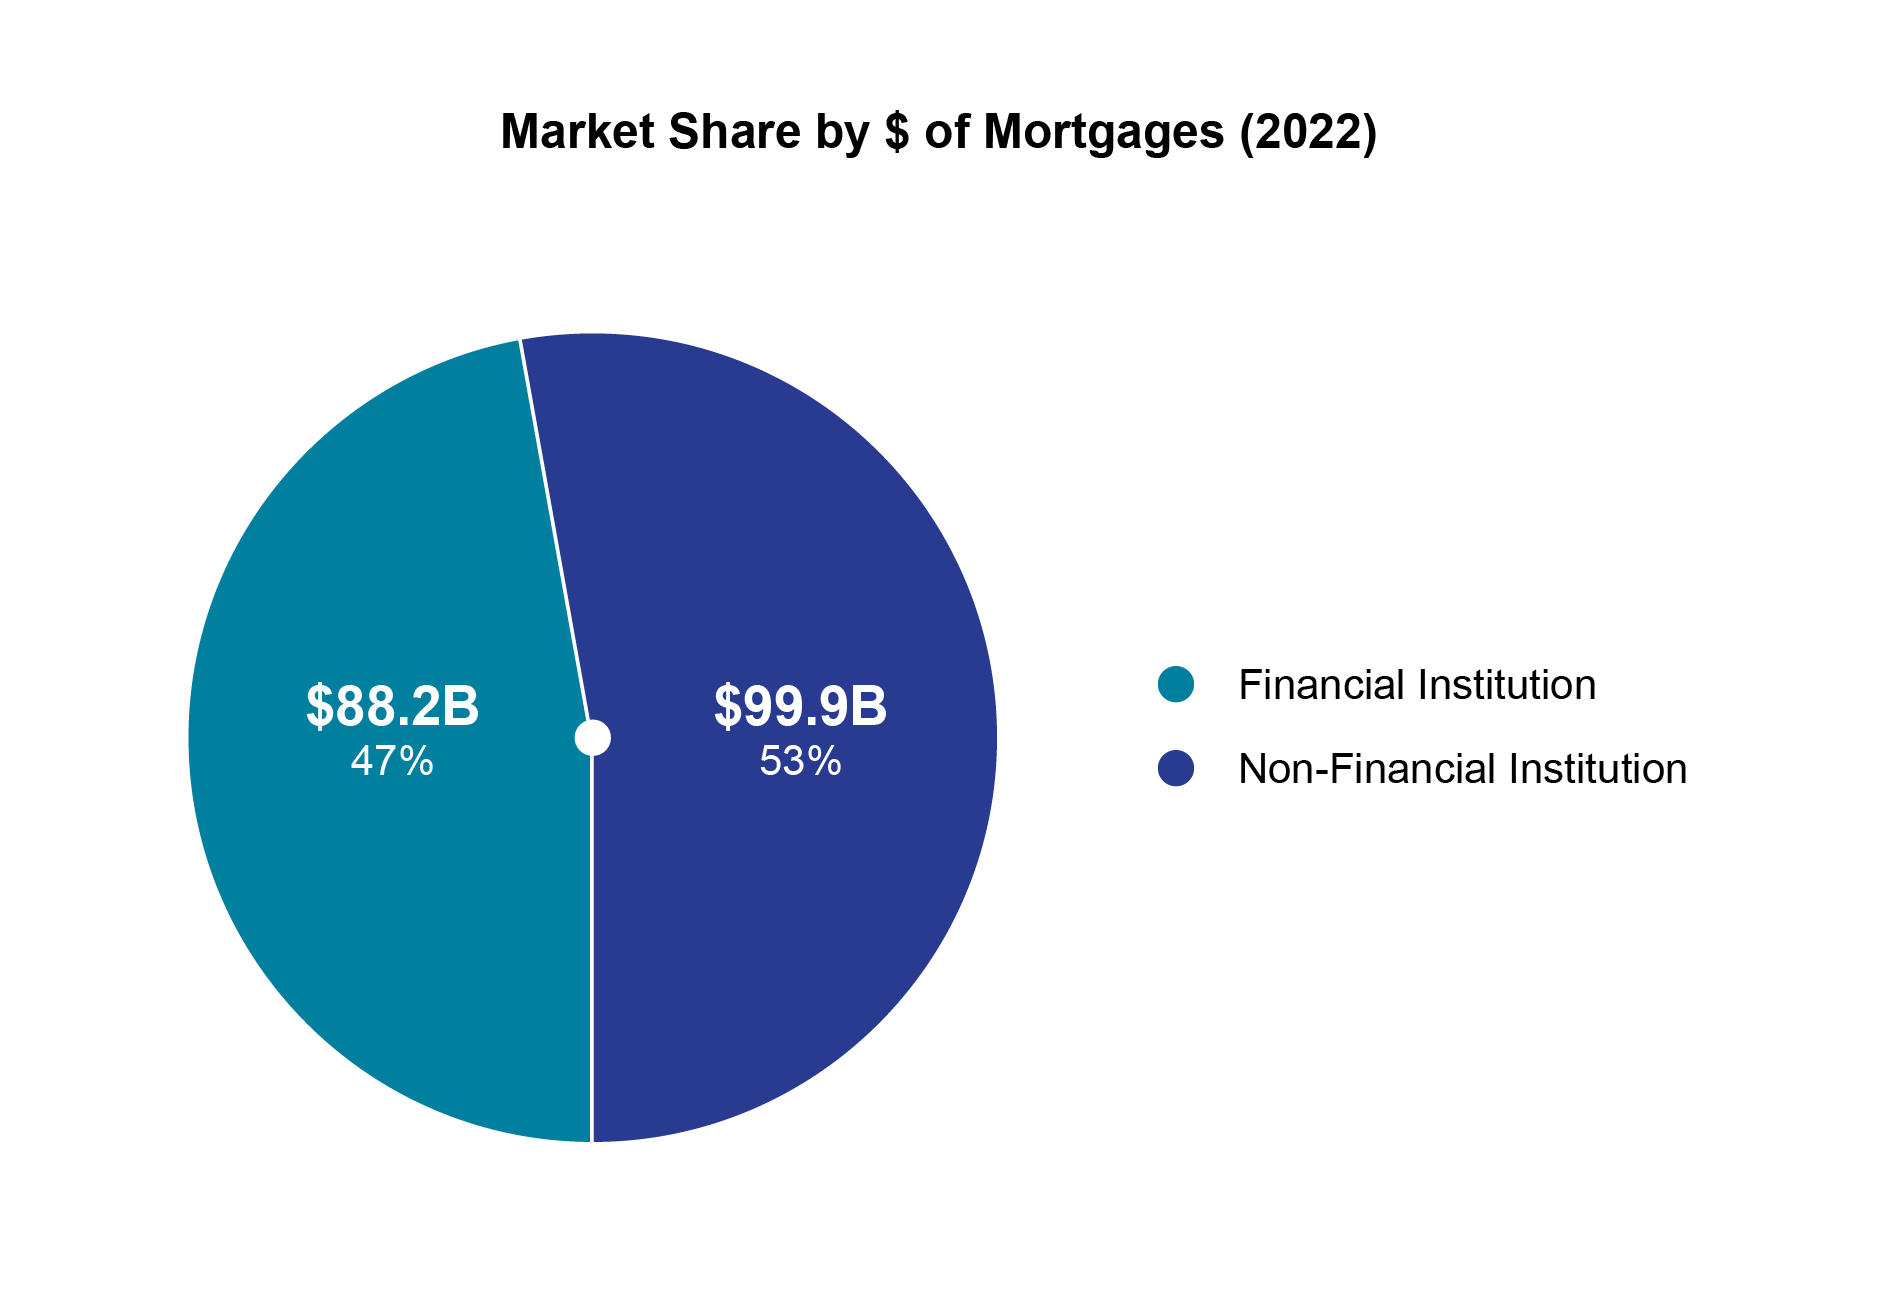
Despite an increase in the number of brokerages using Banks to fund mortgages, the market share of brokered mortgages funded by Financial Institutions decreased in 2022 ceding market share to Alternative Lenders. This is likely a reflection in the increased cost of borrowing restricting some borrowers from qualifying for a mortgage with a Bank.
Banks
Banks remained the largest source of funding for brokered mortgages by number and dollar value of mortgages in 2022.
Banks accounted for 37.1 per cent of the total value and 35.1 per cent of the total number of brokered mortgages in 2022.
The value of mortgages funded by banks decreased 17.7 per cent in 2022 to $69.7 billion from 2021, while the number of mortgages funded by these financial institutions decreased 22.6 per cent to 119,072 in 2022.
The number of brokerages using banks to fund mortgages increased by 7.9 per cent to 683 in 2022 from 633 in 2021.
Credit unions
The value of mortgages funded by credit unions rose 4.1 per cent in 2022 to $7.3 billion from 2021, while the number of mortgages funded by credit unions decreased by 3 per cent to 11,109 in 2022.
The number of brokerages using credit unions to fund mortgages decreased by 4.7 per cent to 348 in 2022 from 365 in 2021.
Insurance companies
The value of mortgages funded by insurance companies decreased by 8.3 per cent in 2022 to $1.7 billion from 2021, while the number of mortgages funded by insurance companies decreased by 17.4 per cent to 333 in 2022.
The number of brokerages using insurance companies to fund mortgages decreased by 10.9 per cent to 41 in 2022 from 46 in 2021.
Trust companies
The value of mortgages funded by trust companies increased by 16.2 per cent in 2022 to $9.5 billion from 2021, while the number of mortgages funded by trust companies decreased by 5.1 per cent to 15,192 in 2022.
The number of brokerages using trust companies to fund mortgages increased by 12.8 per cent to 424 in 2022 from 376 in 2021.
Image
Image
Non-Financial Institution/Alternative Lenders
Non-Financial Institution/Alternative Lenders are generally non-deposit-taking entities (and individuals). They provide mortgages to consumers through the mortgage brokering sector.
FSRA collects information about alternative lending through the AIR. Brokerages report their use of alternative lenders, which are categorized in the AIR as follows: MFCs, Self-funding (licensed mortgage brokerages funding their own mortgages), MICs, Mortgage Investment Entities (MIEs), Private Lenders (entities and individuals) and Other.
Qualified Syndicated Mortgages and Non-Qualified Syndicated Mortgages were added in the 2022 AIR to capture transactions where two or more lenders were involved in the transaction.
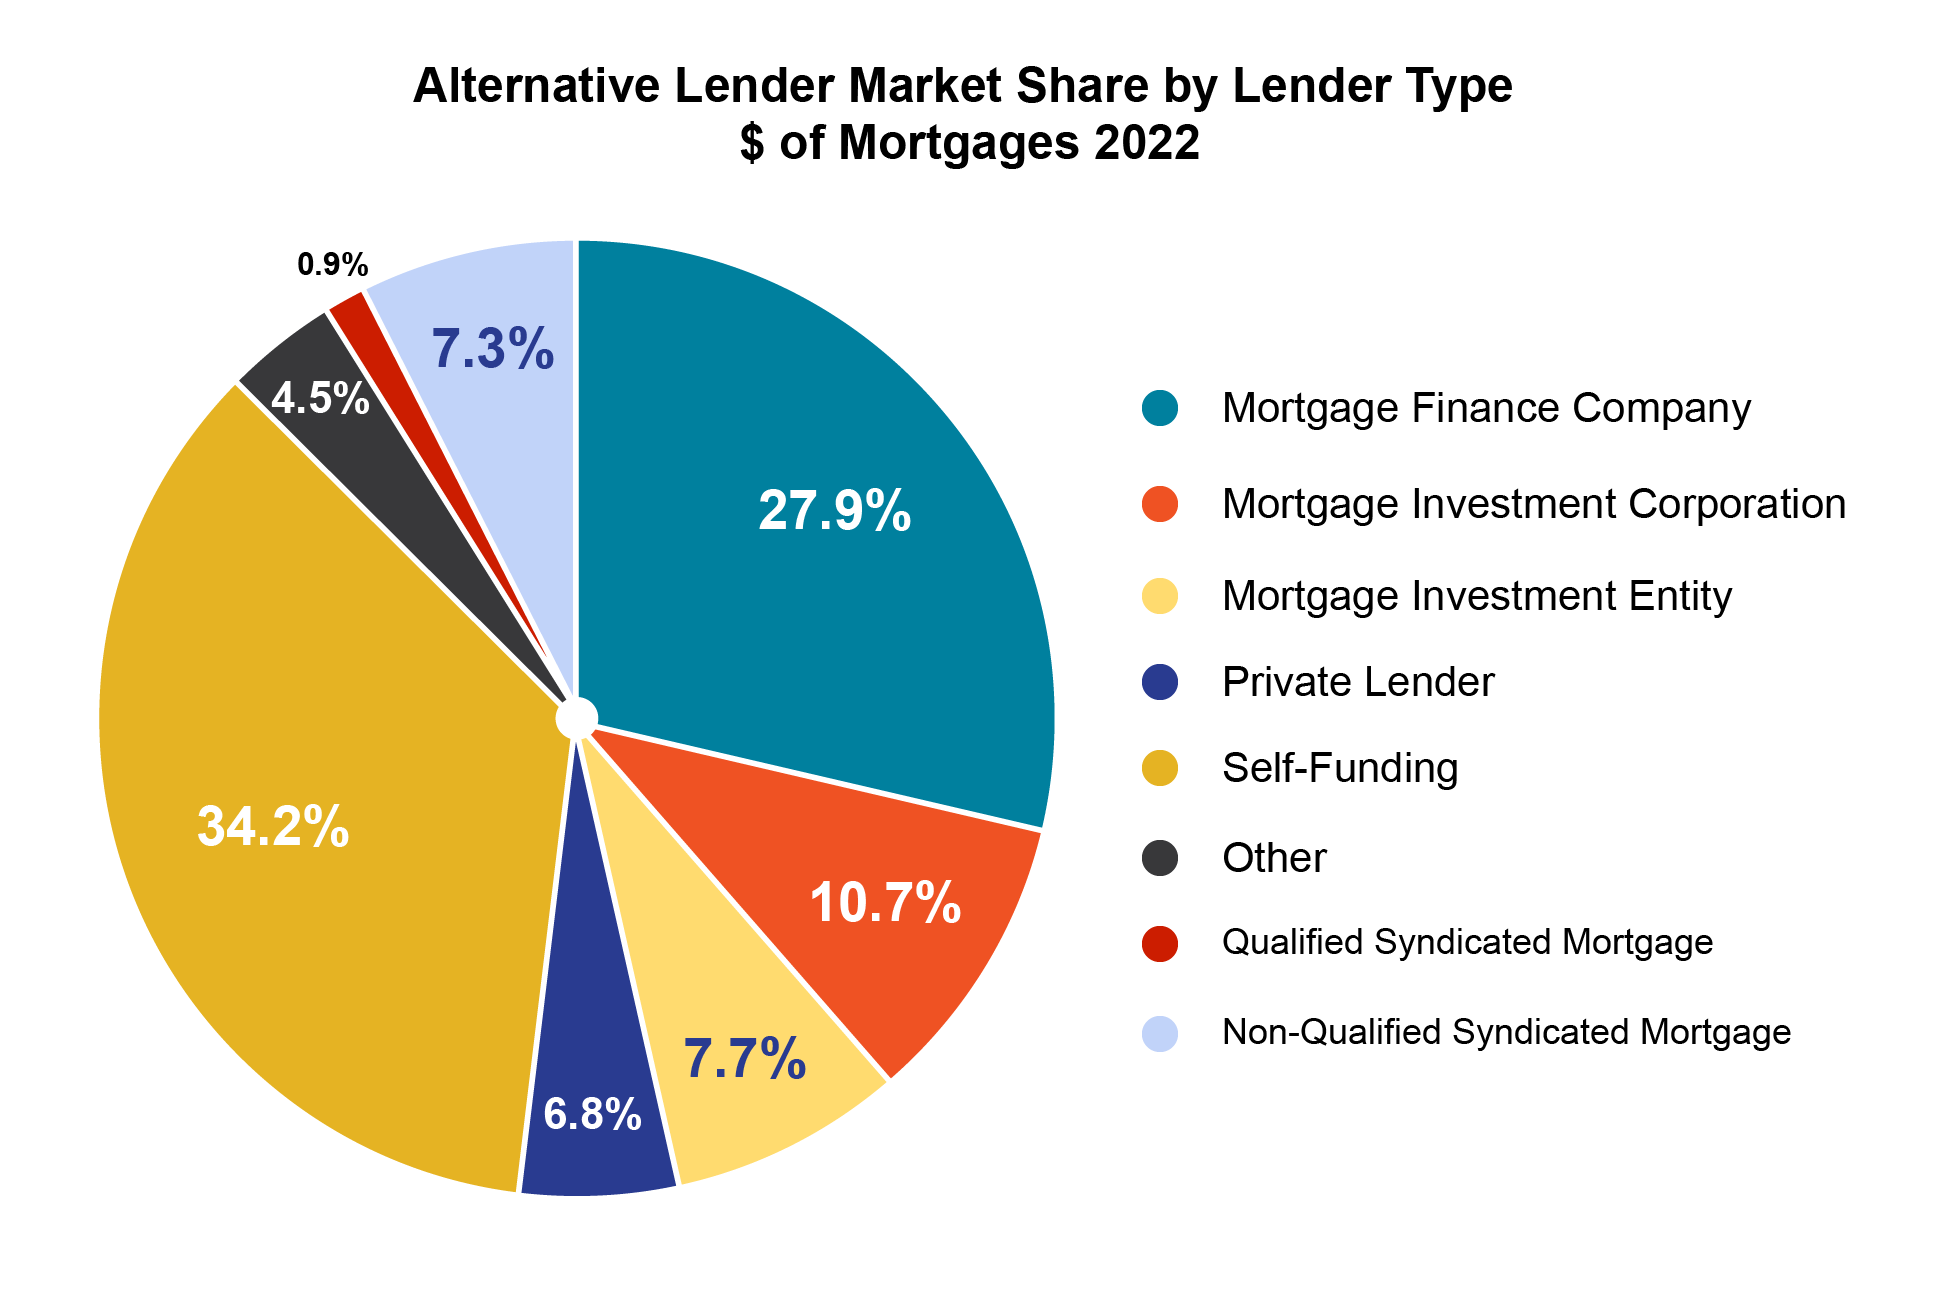
In 2022, Non-Financial Institution/Alternative Lenders gained significant market share of mortgage transactions in the mortgage brokering sector which can be explained by the tightening of lending rules by banks and CMHC.
Mortgage Finance Companies[7]
MFCs were introduced as a category of Non-Financial Institution/Alternative Lender in the 2019 AIR. Prior to 2019, FSRA observed that mortgage brokerages reported funding through MFCs across various lender categories (i.e., not reported consistently in one category of lender). The addition of MFCs as a distinct lender category will support a better understanding of MFC lending in the market. These lenders are typically licensed mortgage brokerages that engage in mortgage lending using their own funds.
In 2022, the value of mortgages funded by MFCs decreased by 8.1 per cent from 2021 to $27.9 billion. The number of mortgages funded by these entities decreased 9.7 per cent from 2021 to 60,125. MFC mortgages are typically sourced from brokers, but some are sourced from clients directly. These mortgages tend to be packaged and sold to regulated financial institutions. Therefore, they must adhere to mortgage lending rules to satisfy the requirements of both their institutional buyers and the Canada Mortgage and Housing Corporation regarding the public insurance of residential mortgages. As a result of these two considerations, MFCs are often considered to be quasi-regulated[8]. Thus, the decline in their activity, is similar to the decline in Bank activity.
MFCs accounted for the third largest share of brokered mortgages in 2022. MFCs accounted for 17.7 per cent (60,125) of the total number of brokered mortgages in 2022 versus a 19.5 per cent share in 2021. Similarly, their share of the total value of mortgages decreased to 14.8 per cent ($27.9 billion) in 2022 from 16.7 per cent in 2021.
The number of brokerages who reported using MFCs rose 7.8 per cent in 2022 from 2021 to 499.
Self-Funding[9]
In 2022, the value of mortgages self-funded by brokerages increased by 55.1 per cent from 2021 to $34.2 billion. The number of mortgages funded by these licensees increased by 59.8 per cent from 2021 to 88,772.
Self-Funding regained its position as the second largest source of mortgage funds in 2022 after losing it in 2021. Self-Funding accounted for 26.2 per cent of the total number and 18.2 per cent of the total value of mortgages in 2022 versus 16.2 per cent and 12.1 per cent market share, respectively, in 2021.
The number of brokerages reporting Self-Funding declined 6.7 per cent from 2021 to 83[10].
Mortgage Investment Corporations[11]
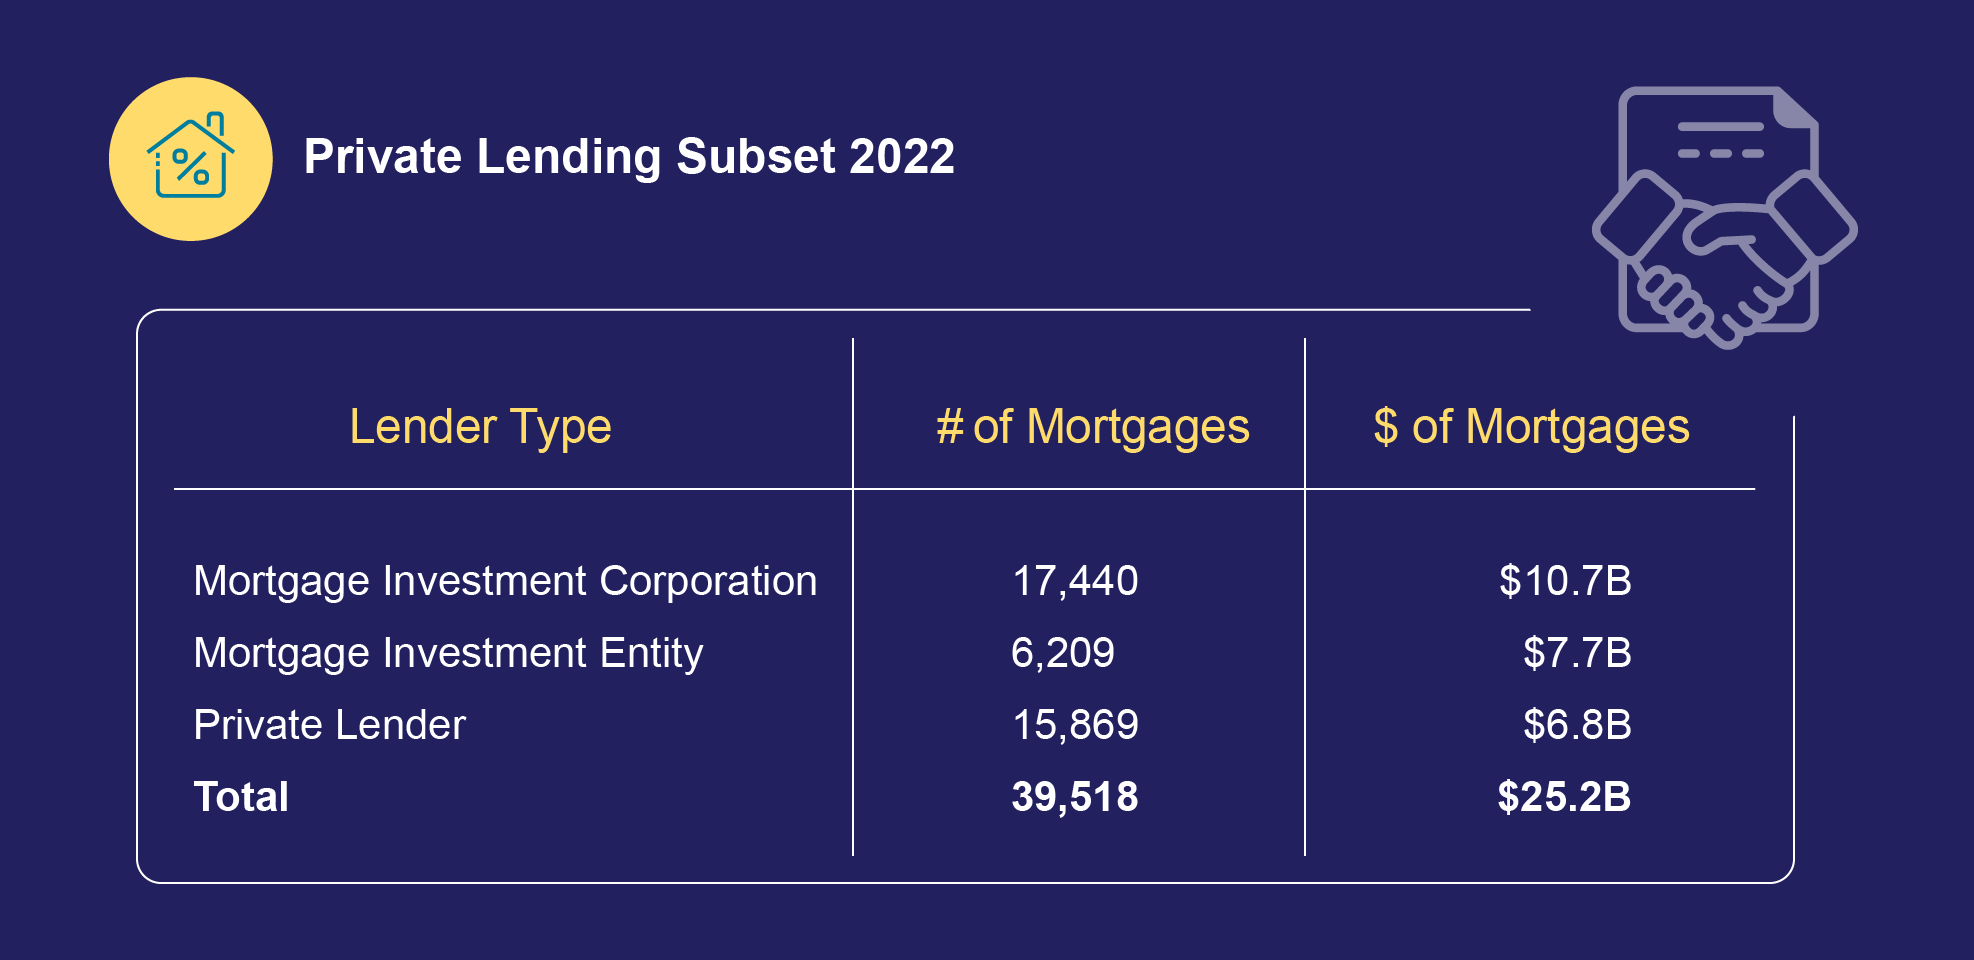
In 2022, the value of mortgages funded by MICs rose 31.9 per cent from 2021 to $10.7 billion. The number of mortgages funded by MICs rose 14.6 per cent from 2021 to 17,440.
MIC’s market share of the number of total mortgages funded rose to 5.1 per cent in 2022 from 4.4 per cent in 2021. Their share of the total value of mortgages rose to 5.7 per cent in 2022 from 4.5 per cent 2021. This suggests an increasing number of brokerages/borrowers turned to MICs for funding of smaller value loans.
The number of brokerages using MICs in 2022 rose 7.8 per cent from 2021 to 471.
Analysis of the MIC names used by brokerages indicates that there were more than 200 different MICs that funded mortgages in 2022.
Mortgage Investment Entities[12]
MIEs were introduced as a category of non-bank lenders in the 2021 AIR. Prior to 2021, FSRA observed that mortgage brokerages reported funding through MIEs across private lenders and MIC lender categories.
The addition of MIE as a distinct lender category will support a better understanding of this lender category in the market.
In 2022, MIEs funded $7.7 billion in mortgages representing approximately 4.1 per cent of total value of mortgage broker transactions.
The number of brokerages using MIEs in 2022 rose 20.9 per cent from 2021 to 110.
Private Lenders[13]
The value of mortgages funded by Private Lenders (individuals and entities) decreased marginally by 0.3 per cent in 2022 from 2021 to remain at $6.8 billion despite a 3.4 per cent increase in the number of mortgages they funded in 2022 to 15,869.
The share of funding by Private Lenders decreased marginally in from 2021 (at 3.6 per cent of the total value and 4.7 per cent of the total number of mortgages).
The number of brokerages using Private Lenders decreased by 2.2 per cent in 2022 from 504 in 2021 to 515.
Analysis of the names of Private Lenders used by brokerages to fund mortgages indicated there were more than 2,200 unique Private Lenders in 2022. Over 72 per cent of these were names of individuals (vs entities).
Although mortgages funded by MICs and private lenders are not a large proportion of the total mortgage market, given their unregulated underwriting practices, FSRA’s supervision priorities for 2022-23 included a review of brokerages working with these alternative lenders. Relative to mortgages from Financial Institutions, mortgages from Alternative Lenders generally have higher loan-to-value or loan-to-income ratios. These lenders may also be more willing to lend to borrowers who are less financially resilient. FSRA will continue to monitor this segment as part of its 2023-2024 supervisory plan to ensure brokers and agents are properly assessing the suitability of these alternative mortgages for a client when presenting them as options for the client.
Other Lenders[14]
The value of mortgages funded by Other Lenders decreased by 12.5 per cent in 2022 from 2021 to $4.5 billion. The number of mortgages funded by these lenders increased by 74.3 per cent in 2022 from 2021 to 2,723.
| Total Mortgages | Alternative Lender Mortgages | |||
|---|---|---|---|---|
| Mortgage type | Share of total number of mortgages | Share of total value of mortgages | Share of the number of alternative lender mortgages | Share of the value of alternative lender mortgages |
|
Bank |
35.14% |
37.08% |
Na |
Na |
|
Credit union |
3.28% |
3.86% |
Na |
Na |
|
Insurance Company |
0.10% |
0.88% |
Na |
Na |
|
MFC |
17.74% |
14.82% |
31.12% |
27.90% |
|
MIC |
5.15% |
5.70% |
9.03% |
10.74% |
|
MIE |
1.83% |
4.07% |
3.21% |
7.66% |
|
Private lender |
4.68% |
3.64% |
8.21% |
6.85% |
|
Self-funding |
26.20% |
18.17% |
45.95% |
34.21% |
|
Trust company |
4.48% |
5.08% |
Na |
Na |
|
Other |
0.80% |
2.38% |
1.41% |
4.48% |
|
Qualified Syndicated Mortgage |
0.36% |
0.47% |
0.63% |
0.88% |
|
Non-Qualified Syndicated Mortgage |
0.24% |
3.86% |
0.42% |
7.27% |
Private lending subset 2022
Image
Image
Image
Image
| Dollar of Mortgages (Billions) | Market Share (by dollars funded) | |||||
|---|---|---|---|---|---|---|
| Lender Type | 2020 | 2021 | 2022 | 2020 % Share | 2021 % Share | 2022 % Share |
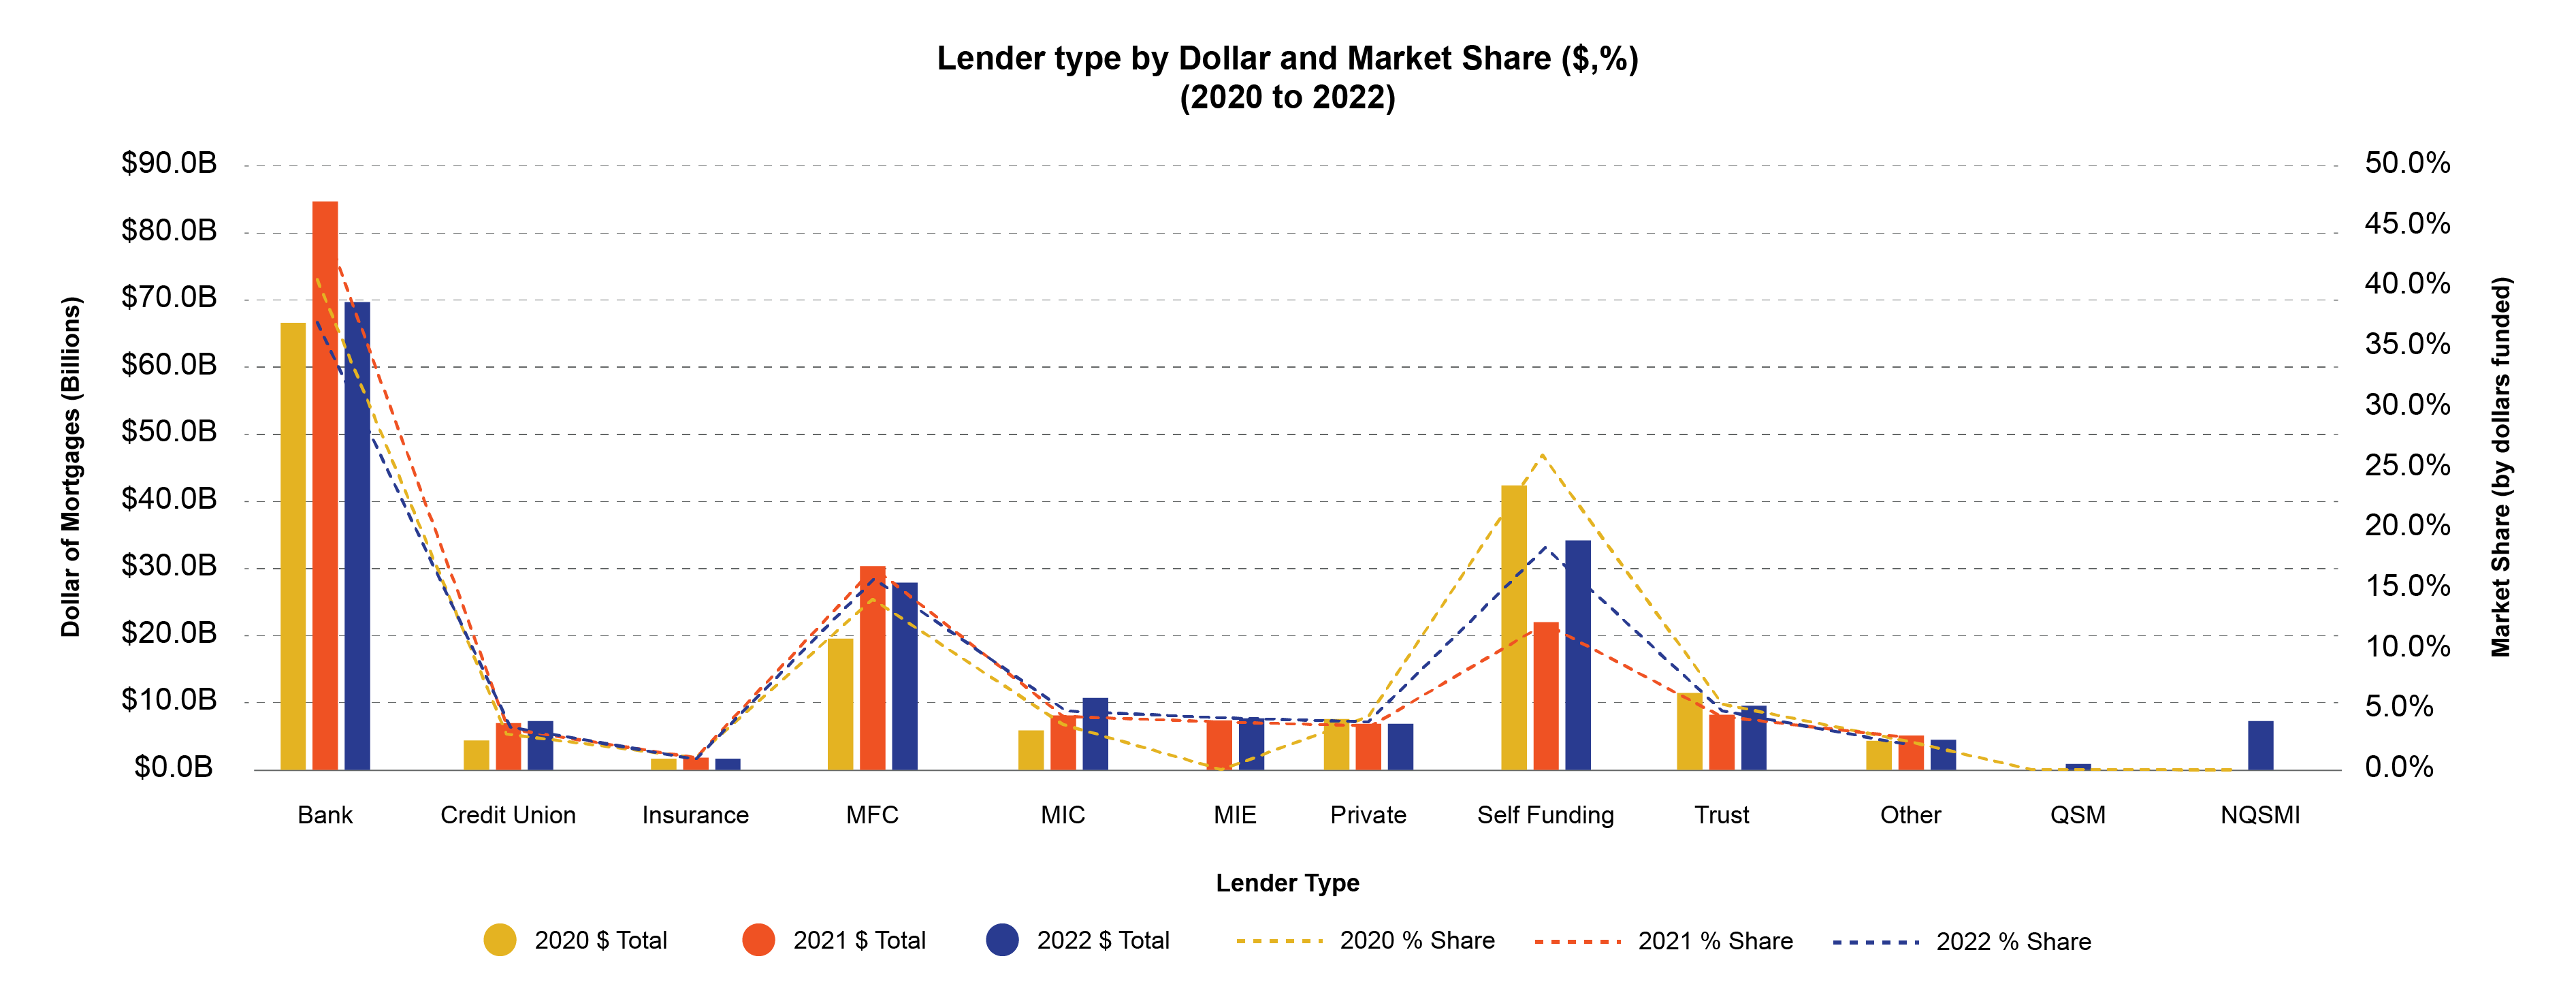
| Bank | $66.6B | $84.7B | $69.7B | 40.6% | 46.7% | 37.1% |
| Credit Union | $4.4B | $7.0B | $7.3B | 2.7% | 3.8% | 3.9% |
| Insurance Company | $1.7B | $1.8B | $1.7B | 1.0% | 1.0% | 0.9% |
| Mortgage Finance Company | $19.6B | $30.3B | $27.9B | 11.9% | 16.7% | 14.8% |
| Mortgage Investment Corporation | $5.9B | $8.1B | $10.7B | 3.6% | 4.5% | 5.7% |
| Mortgage Investment Entity | $7.4B | $7.7B | 4.1% | 4.1% | ||
| Private Lender | $7.6B | $6.9B | $6.8B | 4.6% | 3.8% | 3.6% |
| Self-Funding | $42.4B | $22.0B | $34.2B | 25.9% | 12.1% | 18.2% |
| Trust Company | $11.5B | $8.2B | $9.5B | 7.0% | 4.5% | 5.1% |
| Other | $4.3B | $5.1B | $4.5B | 2.6% | 2.8% | 2.4% |
| Qualified Syndicated Mortgage | $0.9B | 0.5% | ||||
| Non-Qualified Syndicated Mortgage | $7.3B | 3.9% | ||||
| Total | $164.0B | $181.5B | $188.1B | 100% | 100% | 100% |
Non-Qualified Syndicated Mortgages
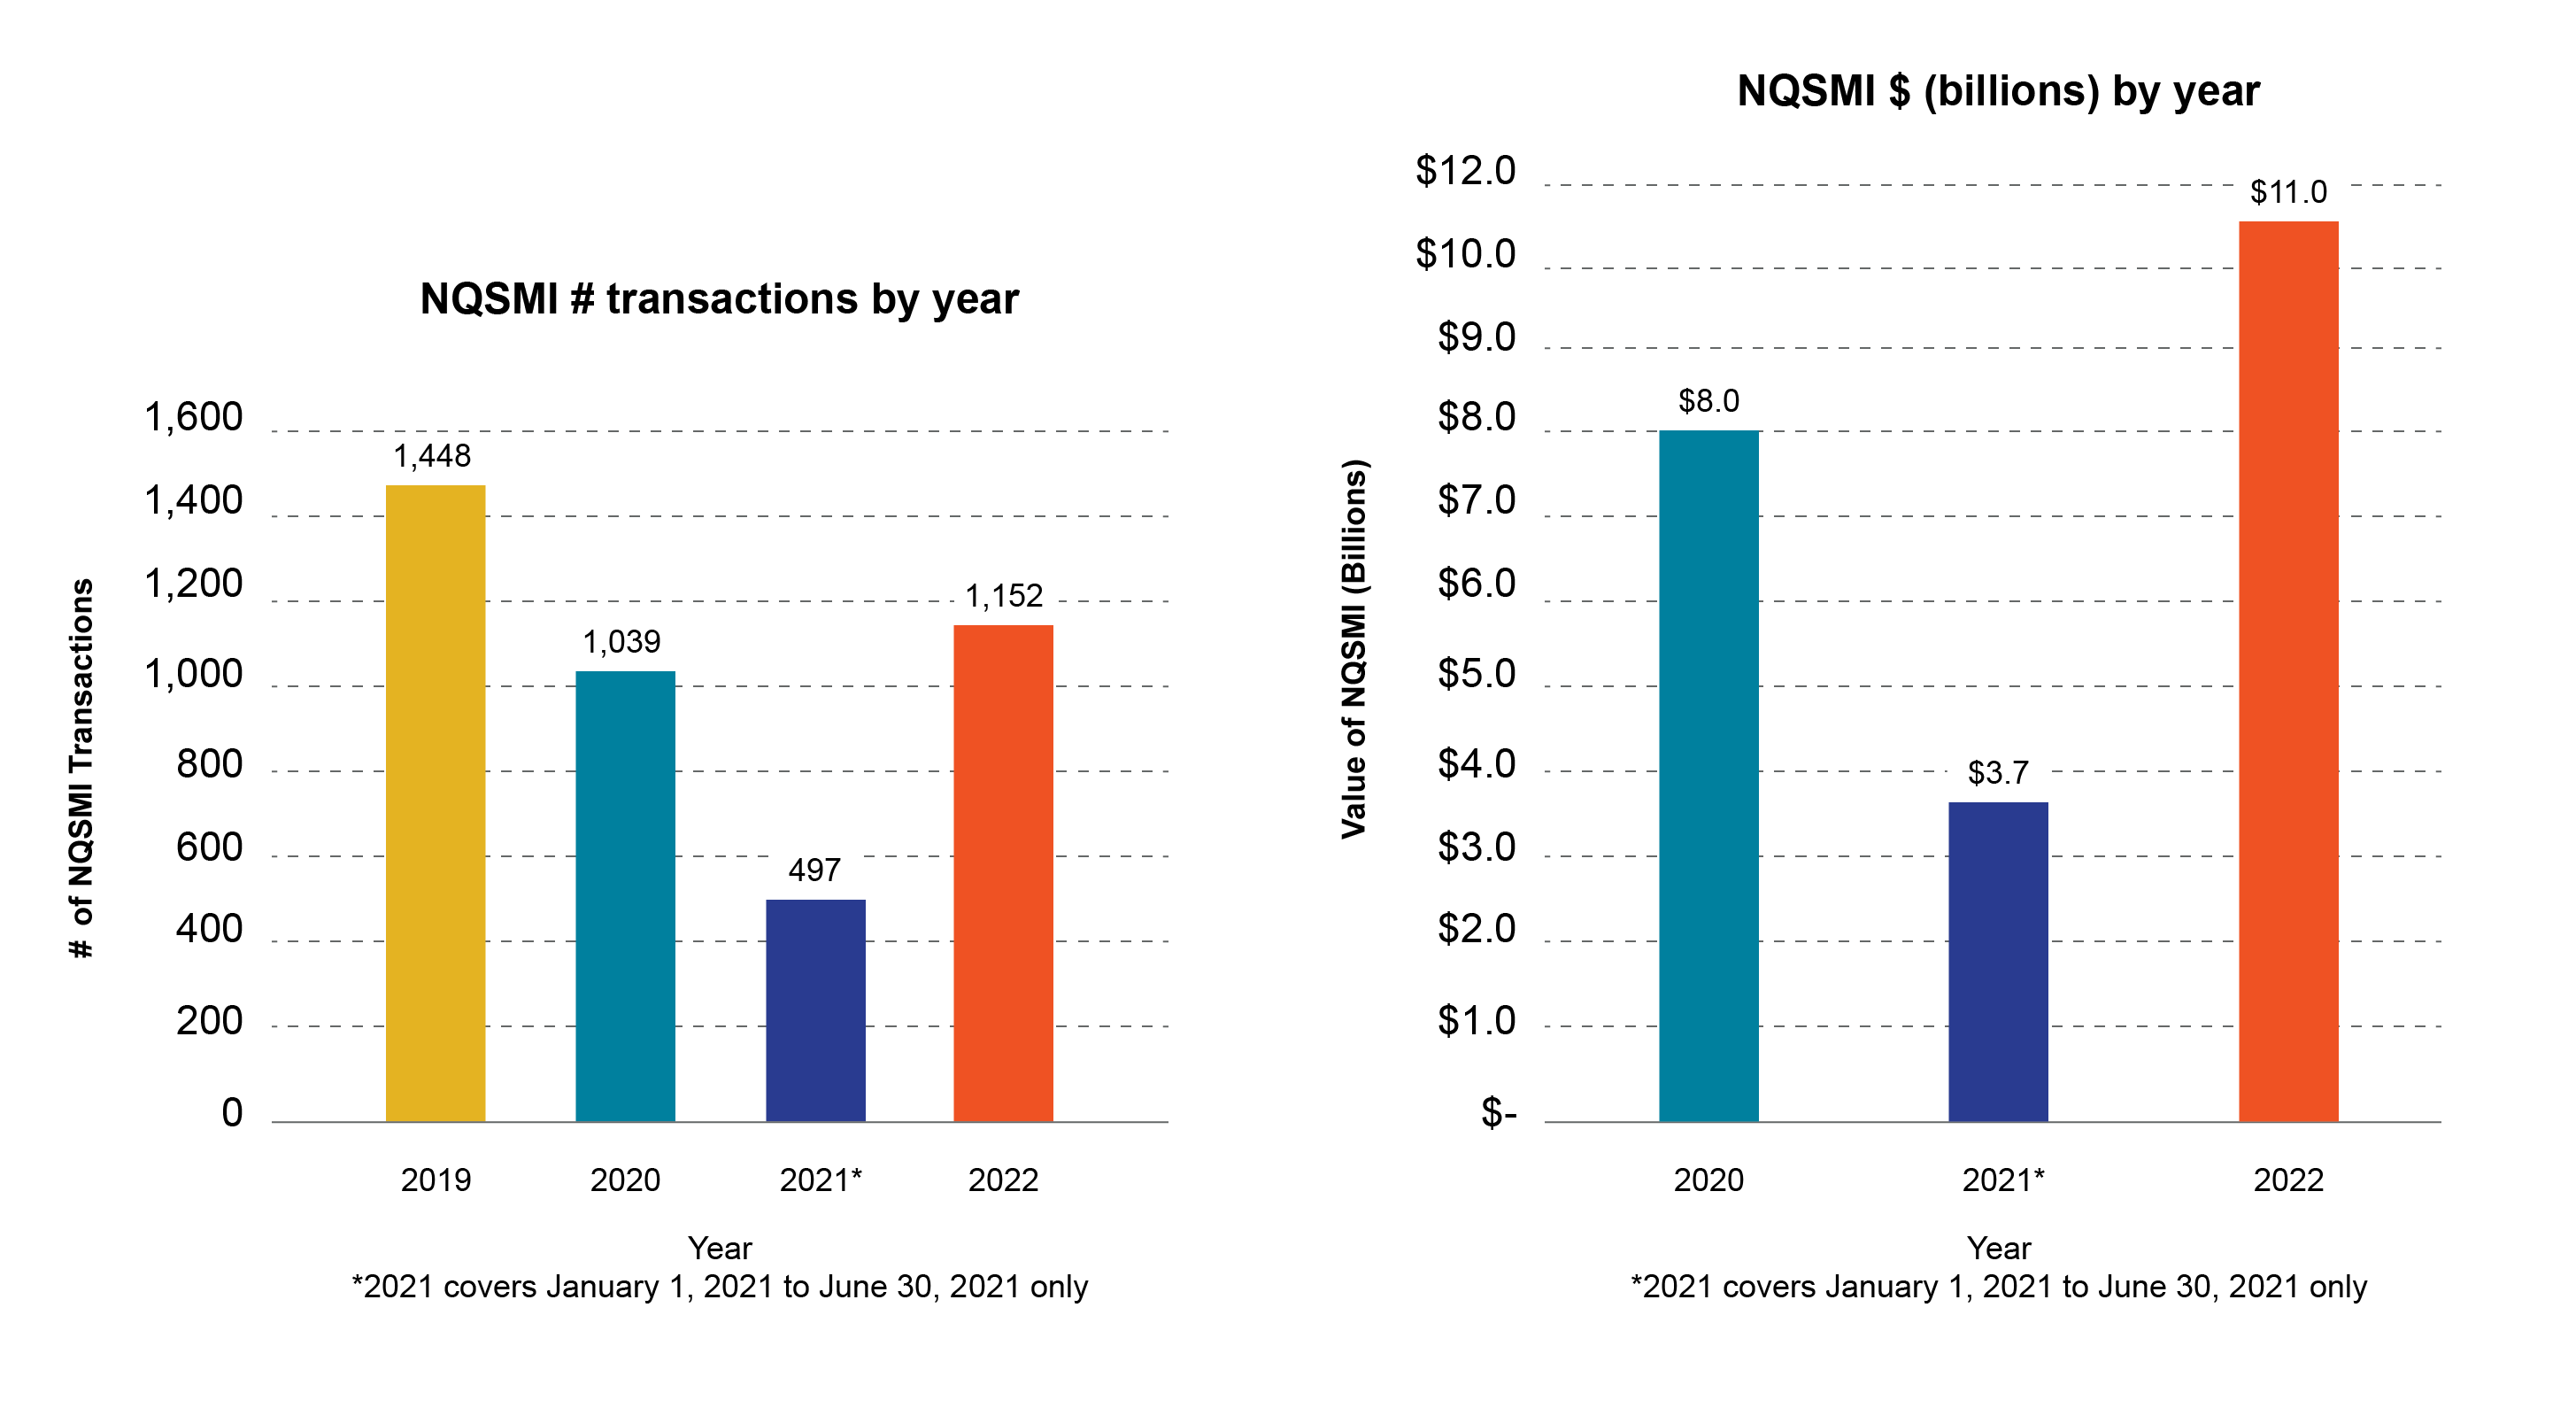
Effective July 1, 2021, oversight of certain NQSMIs was transferred to the Ontario Securities Commission (OSC). That is, new NQSMI transactions with Non-Permitted Client investors/lenders fall under the OSC’s oversight effective that date; and FSRA retains oversight of new NQSMI transactions with Permitted Client investors/lenders, except where specific exemptions apply.
As a result, brokerages are required to report and provide updates on data specific regarding their NQSMI transactions that occurred prior to June 30, 2021.
Between January 1, 2022 to December 31, 2022:
- 46 brokerages reported transacting in NQSMIs (vs 50 in calendar 2021).
- These brokerages reported transacting in 1,105 NQSMIs totalling $11.6 billion. This compares to 994 NQSMIs totalling $7.4 billion in calendar 2021 (annualized).
- Approximately, 93% of these NQSMIs were first mortgages, 6.7% were second rank mortgages and less than half a percentage point were third rank mortgages.
- 31% of these NQSMI were securing development properties, 27% were securing income producing properties and 11% were securing vacant land.
FSRA revised its Supervision Approach for Non-Qualified Syndicated Mortgage Investments with Permitted Clients and Legacy Non-Qualified Syndicated Mortgage Investments (July 1, 2021) guidance on June 27, 2022. The revision removed the requirement to file quarterly NQSMI reports[15] with FSRA and reincorporate NQSMI data for the entire calendar year into the AIR, resulting in the year-over-year increase of NQSMI’s reported.
Image
Mortgage administrators overview
Image
Key observations – Mortgage administrators
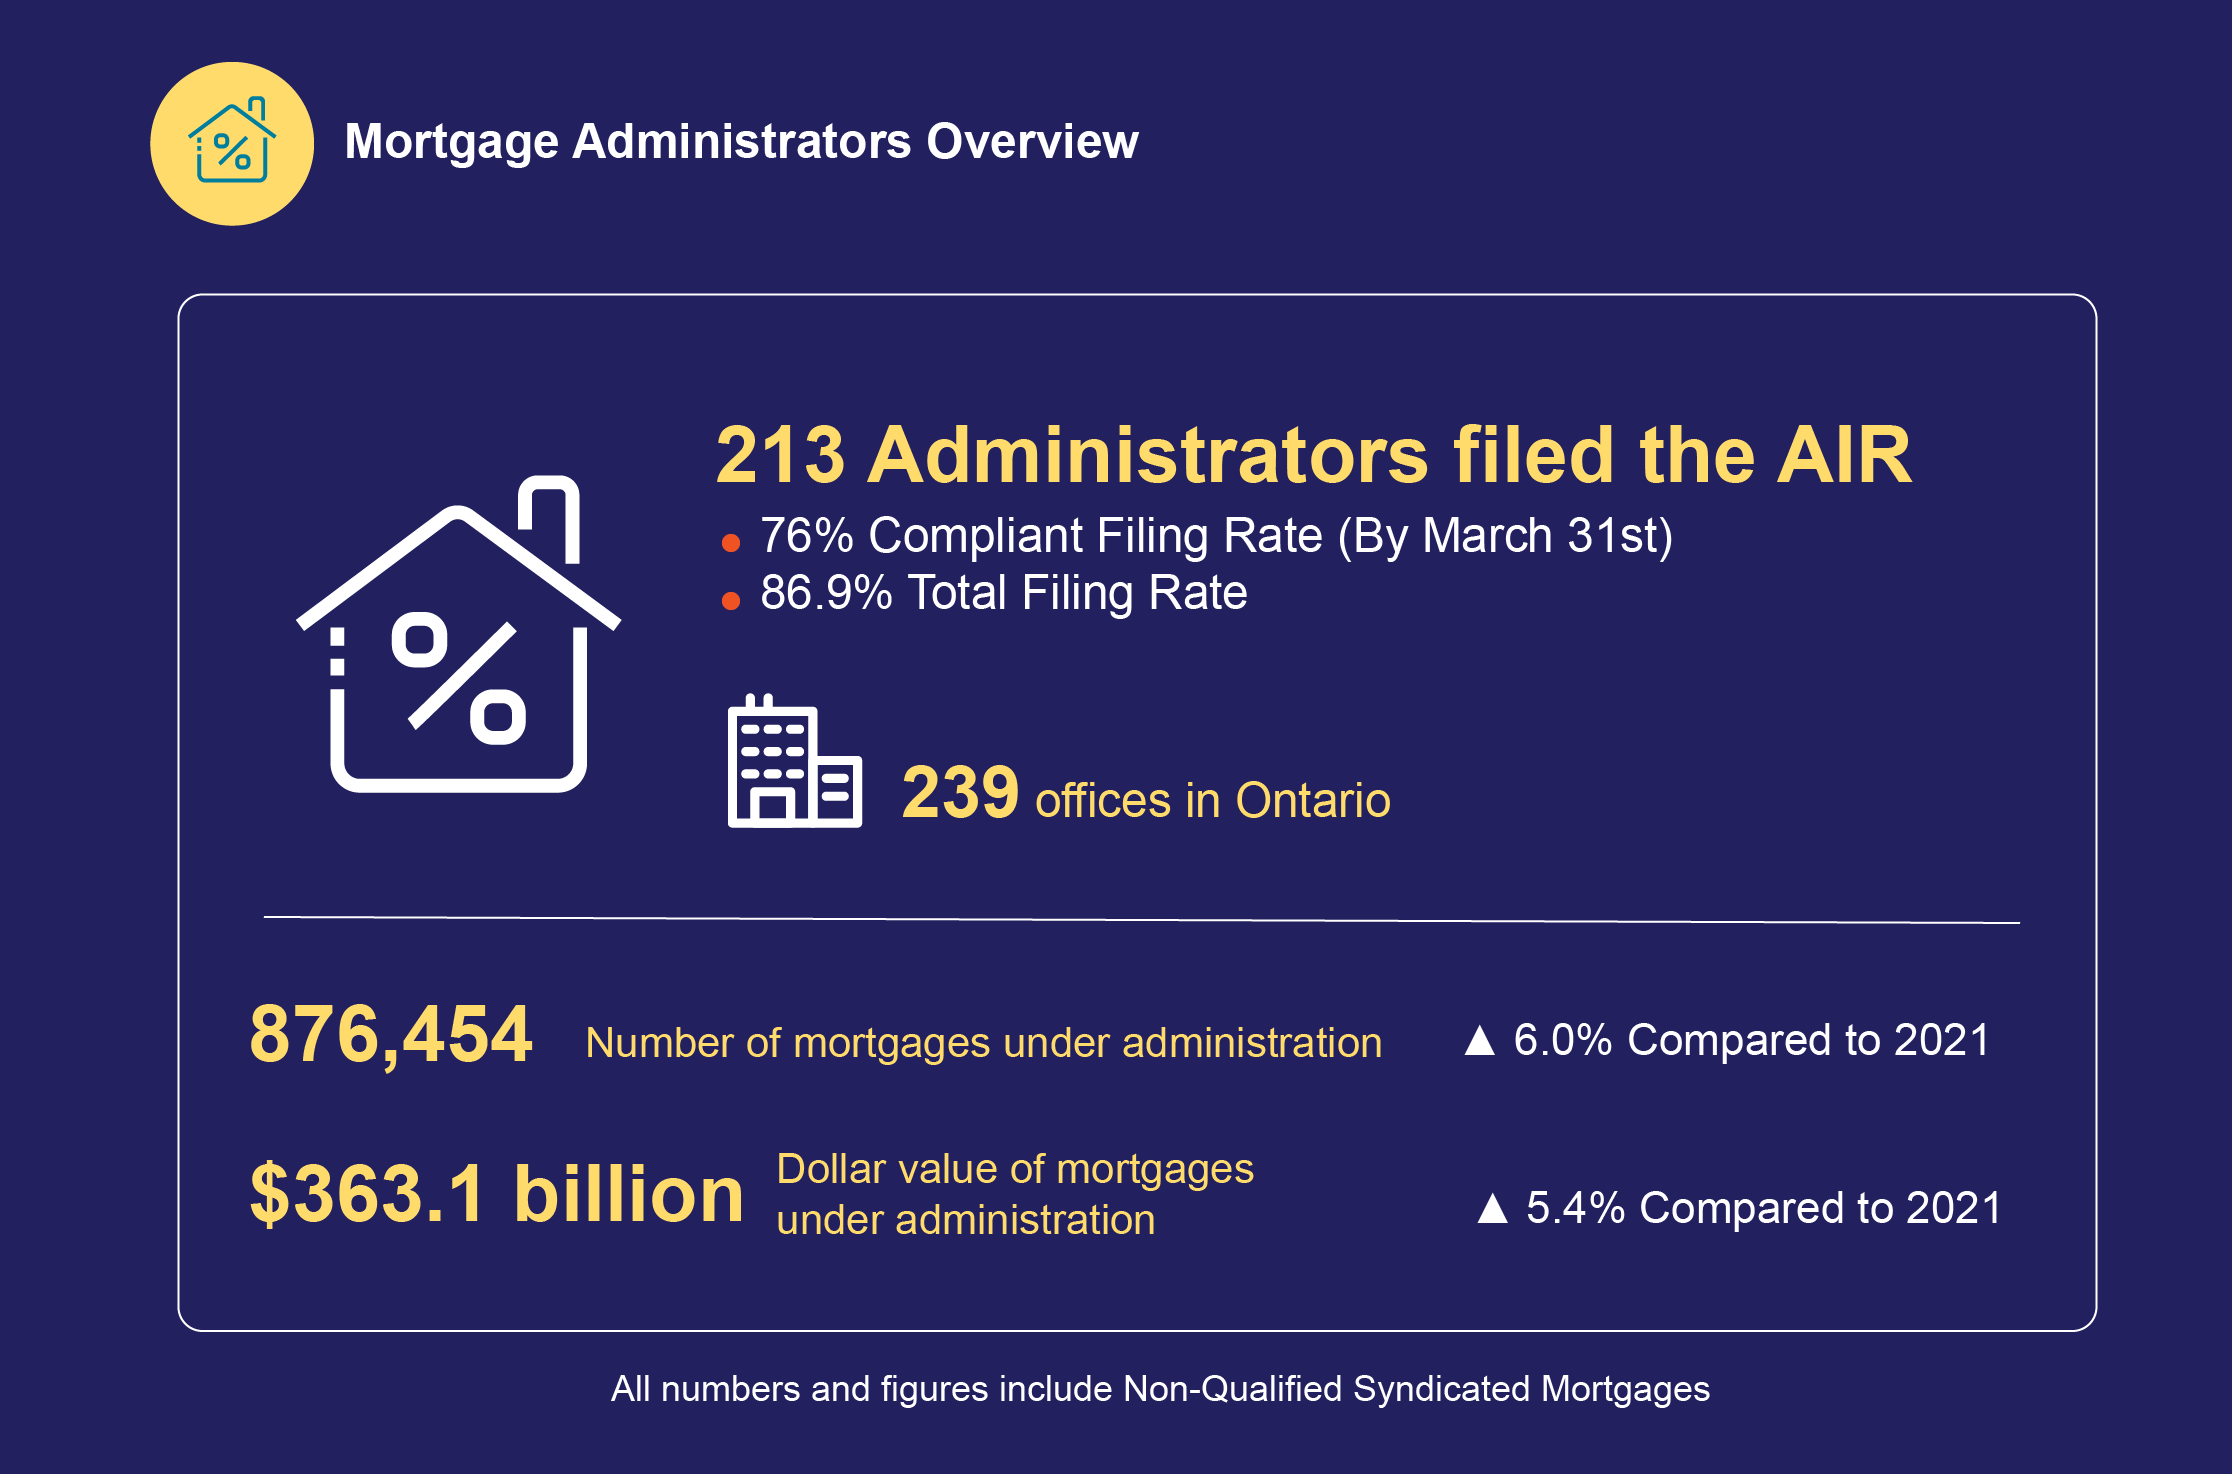
The number of mortgage administrators remained unchanged in 2022 from 2021 at 213.
The number of mortgages under administration rose 6 per cent in 2022 from 2021 to 876,454 and the dollar value of mortgages under administration rose 5.4 per cent in 2022 from 2021 to $363.1 billion.
For mortgages under administration on properties within Ontario, the number of mortgages in arrears rose 121.2 per cent in 2022 from 2021 to 2,303 and the dollar value of mortgages in arrears rose 62.8 per cent to $1.4 billion. The total share of mortgages under administration in Ontario in arrears by number of mortgages in 2022 was 0.8 per cent. The increase in mortgage arrears may be representative of the interest rate increases in variable rate mortgages and the general reduce affordability experienced by many borrowers in Ontario and across Canada.
25 per cent of mortgage administrators (53) reported that they administered NQSMIs.
The number of NQSMI’s under administration decreased 34.4 per cent in 2022 from 2021 to 1,672 and the dollar value of mortgages under administration increased by 51.7 per cent in 2022 from 2021 to $16.1 billion.
45 per cent of mortgage administrators (95) reported that they administered private mortgages (other than a MIC).
The number of private mortgages (other than a MIC) under administration increased by 11.3 per cent in 2022 from 2021 to 9,178 and the dollar value of mortgages under administration increased by 36 per cent in 2022 from 2021 to $10.6 billion.
Methodology
Filing Period: The 2022 AIR filing period ran from January 24, 2022 to March 31, 2022. Submissions received after July 19, 2022 are excluded from this report. The 2022 AIR data reflects mortgage brokerage and administrator volumes during the 2022 calendar year.
Error Detection: Edits are applied at the micro level. Data was subjected to quality checks to detect errors that appear to be clear and obvious or significantly different for the prior year’s filings. 61 mortgage brokerages and 42 mortgage administrators with such material year over year discrepancies were contacted in the summer of 2023 to verify the accuracy of the data and 85% brokerages confirmed errors in their AIR entries while this percentage was over 78% for the administrators.
Data Accuracy: AIR data was collected from licensed mortgage brokerages (90 per cent) and mortgage administrators (87 per cent) who were required to file a 2022 AIR. Entities filed their AIRs electronically. AIR data may be subject to human error during data entry.
Information reported in the AIR is subject to data validation checks and FSRA follows-up with brokerages and administrators as needed. To validate aggregate data collected in the AIR, comparative analysis is performed against external data from sources such as Canadian Real Estate Association (CREA), Teranet, Canada Mortgage and Housing Corporation (CMHC), and Statistics Canada.
Appendix
Appendix data [XLSX]
[1] The denominator excludes the number of licensees that surrendered their licences.
[2] CREA, 2022 Annual Report
[3] Other mortgages are those not included as residential or commercial (e.g., hobby farm, raw land not under development).
[4] In the 2022 AIR, a Conventional mortgage is defined as having a Loan to Value Ratio less than or equal to 80%.
[5] In the 2022 AIR, a sub-prime mortgage is defined as a mortgage for individual(s) with a mean credit score of 600 points or less.
[6] Equity-Based Lending (or Asset-based Lending): the generic term for mortgage lending based primarily on the value and marketability of the real estate property collateral and other additional securities. Some examples of equity-based lending solutions offered by 'Alternative Lenders' are stated Income. No Income Qualifier (NIQ), No Documentation, or Self-Employed Mortgages and require little or no income documents, relying on risk mitigation strategies by knowledgeable brokerages.
[7] A Mortgage Finance Company is a non-depository financial institution that underwrites, and services mortgages sourced through brokers.
[8] Statistics Canada: Non-bank financial intermediation, 2007 to 2021.
[9] Self Funding: Brokerages that lend their own funds.
[10] In the 2021 and 2022 AIR self-funding did not include mortgages funded by brokers or agents own funds.
[11] Mortgage Investment Corporation (MIC): An investment/lending company designed specifically for mortgage investing or lending, in Canada, and governed by the Income Tax Act (Canada).
[12] Mortgage Investment Entity (MIE), Other than MIC: A MIE is a mortgage-financing business that pools together money from investors to lend on mortgages. MIEs can vary in organizational structure, and may be a trust, a limited partnership or a corporation.
[13] Private Lender: A person or business, other than a MIC or MIE, who lends their own funds for a mortgage including individual mortgage brokers or agents. (Brokerages that lend their own funds are self-funding).
[14] Other lender category captures lenders that mortgage brokerages were unable to classify.
[15] Mortgage brokerages no longer need to file NQSMI quarterly data report